Native/Alaskan vs Immigrants from Iran Male Disability
COMPARE
Native/Alaskan
Immigrants from Iran
Male Disability
Male Disability Comparison
Natives/Alaskans
Immigrants from Iran
14.2%
MALE DISABILITY
0.0/ 100
METRIC RATING
326th/ 347
METRIC RANK
9.7%
MALE DISABILITY
100.0/ 100
METRIC RATING
14th/ 347
METRIC RANK
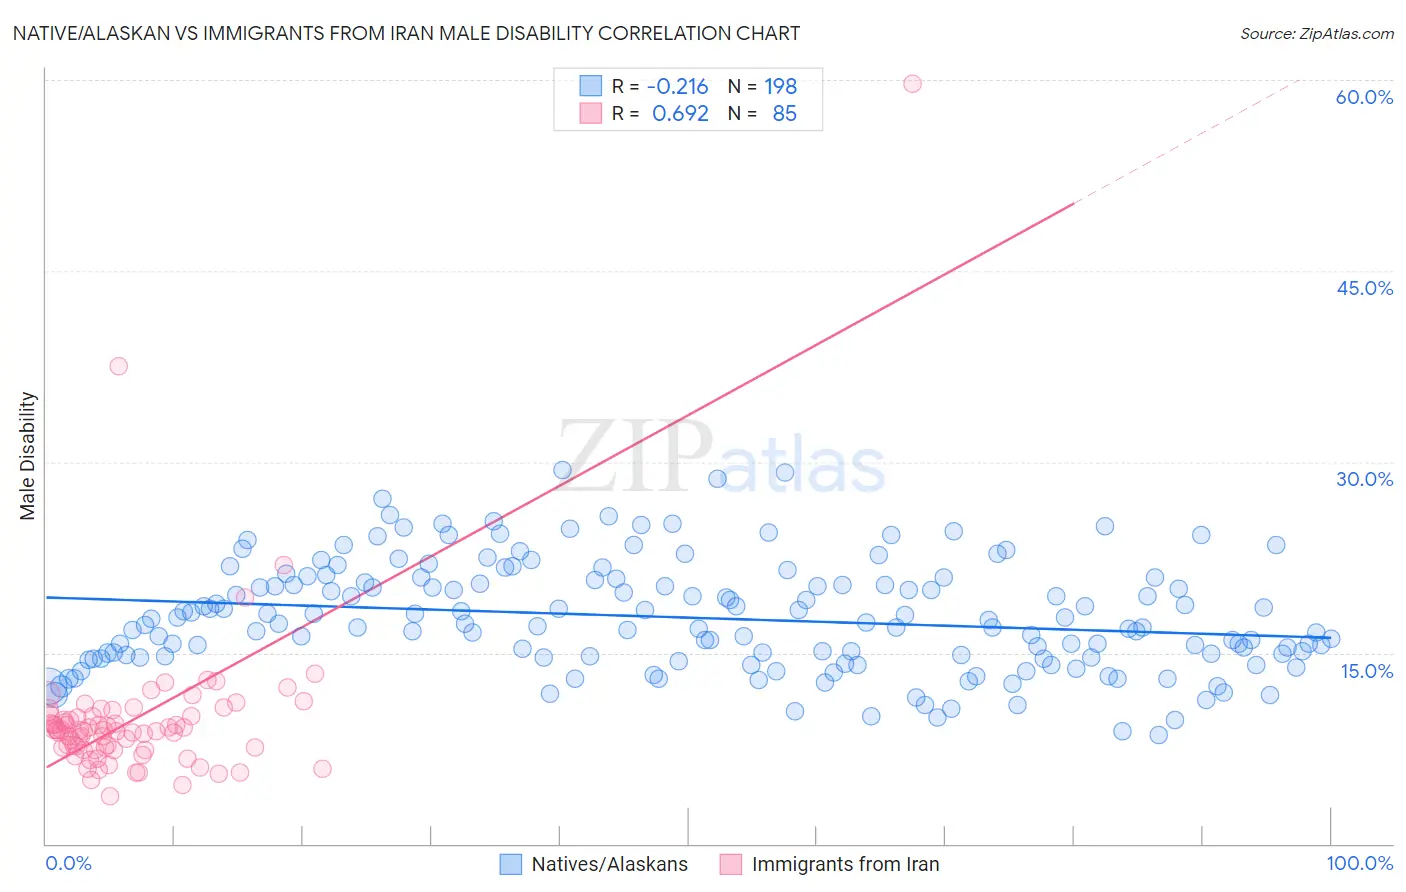
Native/Alaskan vs Immigrants from Iran Male Disability Correlation Chart
The statistical analysis conducted on geographies consisting of 512,854,069 people shows a weak negative correlation between the proportion of Natives/Alaskans and percentage of males with a disability in the United States with a correlation coefficient (R) of -0.216 and weighted average of 14.2%. Similarly, the statistical analysis conducted on geographies consisting of 279,892,018 people shows a significant positive correlation between the proportion of Immigrants from Iran and percentage of males with a disability in the United States with a correlation coefficient (R) of 0.692 and weighted average of 9.7%, a difference of 46.9%.
Male Disability Correlation Summary
| Measurement | Native/Alaskan | Immigrants from Iran |
| Minimum | 8.6% | 3.8% |
| Maximum | 29.4% | 59.7% |
| Range | 20.8% | 55.9% |
| Mean | 17.8% | 9.9% |
| Median | 17.3% | 8.9% |
| Interquartile 25% (IQ1) | 14.7% | 7.5% |
| Interquartile 75% (IQ3) | 20.5% | 10.1% |
| Interquartile Range (IQR) | 5.9% | 2.6% |
| Standard Deviation (Sample) | 4.3% | 6.8% |
| Standard Deviation (Population) | 4.3% | 6.8% |
Similar Demographics by Male Disability
Demographics Similar to Natives/Alaskans by Male Disability
In terms of male disability, the demographic groups most similar to Natives/Alaskans are Potawatomi (14.2%, a difference of 0.10%), Chippewa (14.3%, a difference of 0.53%), Ottawa (14.1%, a difference of 0.94%), Comanche (14.1%, a difference of 1.1%), and Cajun (14.4%, a difference of 1.1%).
| Demographics | Rating | Rank | Male Disability |
| Americans | 0.0 /100 | #319 | Tragic 13.8% |
| Tlingit-Haida | 0.0 /100 | #320 | Tragic 13.8% |
| Shoshone | 0.0 /100 | #321 | Tragic 13.8% |
| Apache | 0.0 /100 | #322 | Tragic 14.0% |
| Osage | 0.0 /100 | #323 | Tragic 14.0% |
| Comanche | 0.0 /100 | #324 | Tragic 14.1% |
| Ottawa | 0.0 /100 | #325 | Tragic 14.1% |
| Natives/Alaskans | 0.0 /100 | #326 | Tragic 14.2% |
| Potawatomi | 0.0 /100 | #327 | Tragic 14.2% |
| Chippewa | 0.0 /100 | #328 | Tragic 14.3% |
| Cajuns | 0.0 /100 | #329 | Tragic 14.4% |
| Navajo | 0.0 /100 | #330 | Tragic 14.4% |
| Tohono O'odham | 0.0 /100 | #331 | Tragic 14.6% |
| Seminole | 0.0 /100 | #332 | Tragic 14.7% |
| Yuman | 0.0 /100 | #333 | Tragic 14.7% |
Demographics Similar to Immigrants from Iran by Male Disability
In terms of male disability, the demographic groups most similar to Immigrants from Iran are Iranian (9.7%, a difference of 0.10%), Bolivian (9.6%, a difference of 0.33%), Indian (Asian) (9.7%, a difference of 0.45%), Immigrants from Eastern Asia (9.6%, a difference of 0.56%), and Okinawan (9.8%, a difference of 1.1%).
| Demographics | Rating | Rank | Male Disability |
| Immigrants | Bolivia | 100.0 /100 | #7 | Exceptional 9.5% |
| Immigrants | China | 100.0 /100 | #8 | Exceptional 9.5% |
| Immigrants | Singapore | 100.0 /100 | #9 | Exceptional 9.5% |
| Immigrants | Israel | 100.0 /100 | #10 | Exceptional 9.6% |
| Immigrants | Eastern Asia | 100.0 /100 | #11 | Exceptional 9.6% |
| Bolivians | 100.0 /100 | #12 | Exceptional 9.6% |
| Iranians | 100.0 /100 | #13 | Exceptional 9.7% |
| Immigrants | Iran | 100.0 /100 | #14 | Exceptional 9.7% |
| Indians (Asian) | 100.0 /100 | #15 | Exceptional 9.7% |
| Okinawans | 100.0 /100 | #16 | Exceptional 9.8% |
| Immigrants | Korea | 100.0 /100 | #17 | Exceptional 9.8% |
| Immigrants | Pakistan | 100.0 /100 | #18 | Exceptional 9.8% |
| Immigrants | Sri Lanka | 100.0 /100 | #19 | Exceptional 10.0% |
| Asians | 100.0 /100 | #20 | Exceptional 10.0% |
| Burmese | 100.0 /100 | #21 | Exceptional 10.0% |