Native/Alaskan vs Immigrants from Panama Male Disability
COMPARE
Native/Alaskan
Immigrants from Panama
Male Disability
Male Disability Comparison
Natives/Alaskans
Immigrants from Panama
14.2%
MALE DISABILITY
0.0/ 100
METRIC RATING
326th/ 347
METRIC RANK
11.5%
MALE DISABILITY
13.0/ 100
METRIC RATING
201st/ 347
METRIC RANK
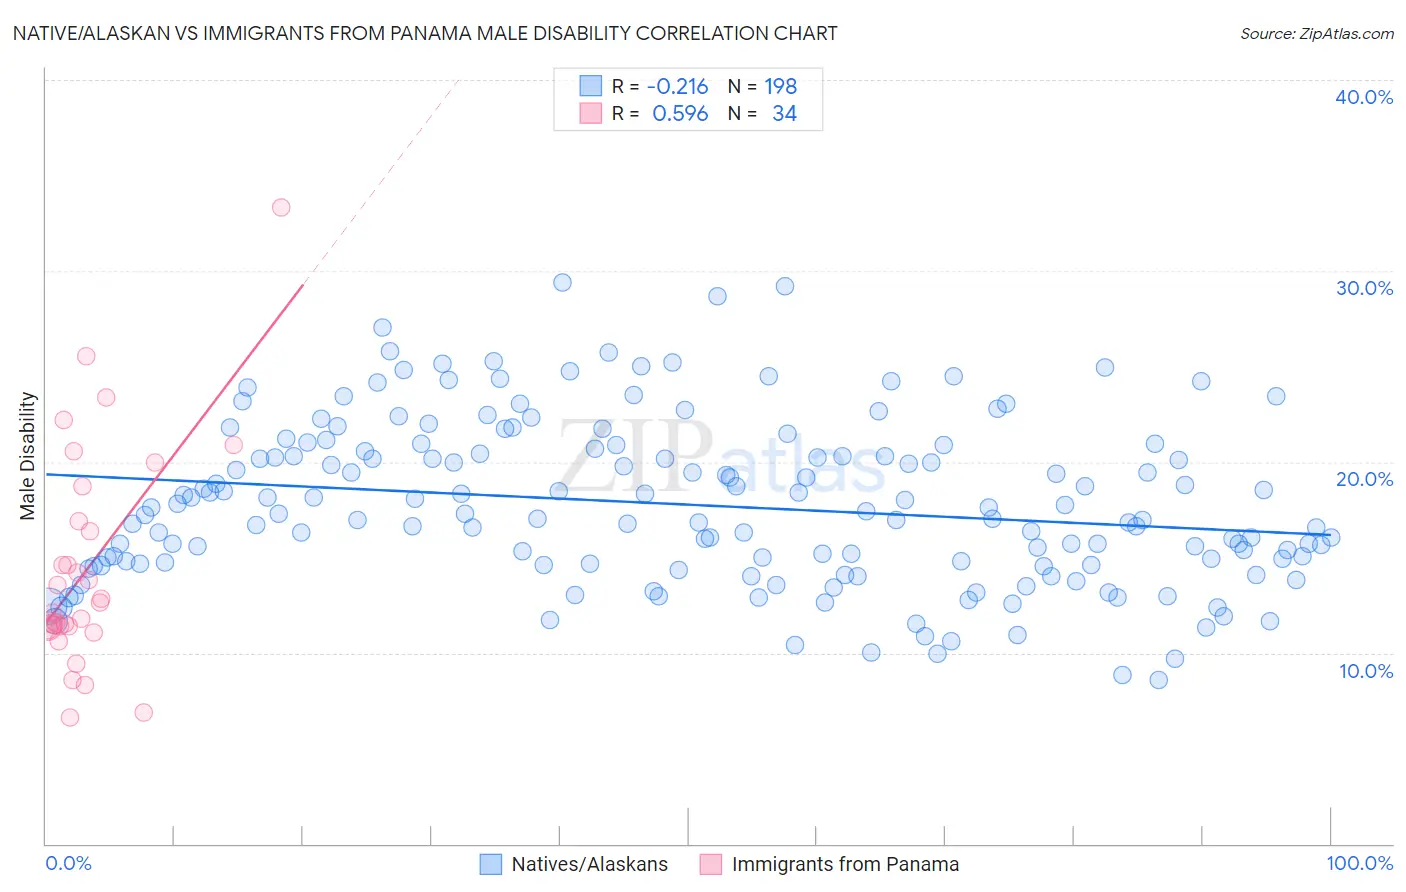
Native/Alaskan vs Immigrants from Panama Male Disability Correlation Chart
The statistical analysis conducted on geographies consisting of 512,854,069 people shows a weak negative correlation between the proportion of Natives/Alaskans and percentage of males with a disability in the United States with a correlation coefficient (R) of -0.216 and weighted average of 14.2%. Similarly, the statistical analysis conducted on geographies consisting of 221,177,932 people shows a substantial positive correlation between the proportion of Immigrants from Panama and percentage of males with a disability in the United States with a correlation coefficient (R) of 0.596 and weighted average of 11.5%, a difference of 23.4%.
Male Disability Correlation Summary
| Measurement | Native/Alaskan | Immigrants from Panama |
| Minimum | 8.6% | 6.6% |
| Maximum | 29.4% | 33.3% |
| Range | 20.8% | 26.7% |
| Mean | 17.8% | 14.4% |
| Median | 17.3% | 12.4% |
| Interquartile 25% (IQ1) | 14.7% | 11.4% |
| Interquartile 75% (IQ3) | 20.5% | 16.9% |
| Interquartile Range (IQR) | 5.9% | 5.5% |
| Standard Deviation (Sample) | 4.3% | 5.7% |
| Standard Deviation (Population) | 4.3% | 5.7% |
Similar Demographics by Male Disability
Demographics Similar to Natives/Alaskans by Male Disability
In terms of male disability, the demographic groups most similar to Natives/Alaskans are Potawatomi (14.2%, a difference of 0.10%), Chippewa (14.3%, a difference of 0.53%), Ottawa (14.1%, a difference of 0.94%), Comanche (14.1%, a difference of 1.1%), and Cajun (14.4%, a difference of 1.1%).
| Demographics | Rating | Rank | Male Disability |
| Americans | 0.0 /100 | #319 | Tragic 13.8% |
| Tlingit-Haida | 0.0 /100 | #320 | Tragic 13.8% |
| Shoshone | 0.0 /100 | #321 | Tragic 13.8% |
| Apache | 0.0 /100 | #322 | Tragic 14.0% |
| Osage | 0.0 /100 | #323 | Tragic 14.0% |
| Comanche | 0.0 /100 | #324 | Tragic 14.1% |
| Ottawa | 0.0 /100 | #325 | Tragic 14.1% |
| Natives/Alaskans | 0.0 /100 | #326 | Tragic 14.2% |
| Potawatomi | 0.0 /100 | #327 | Tragic 14.2% |
| Chippewa | 0.0 /100 | #328 | Tragic 14.3% |
| Cajuns | 0.0 /100 | #329 | Tragic 14.4% |
| Navajo | 0.0 /100 | #330 | Tragic 14.4% |
| Tohono O'odham | 0.0 /100 | #331 | Tragic 14.6% |
| Seminole | 0.0 /100 | #332 | Tragic 14.7% |
| Yuman | 0.0 /100 | #333 | Tragic 14.7% |
Demographics Similar to Immigrants from Panama by Male Disability
In terms of male disability, the demographic groups most similar to Immigrants from Panama are Immigrants from Iraq (11.5%, a difference of 0.0%), Immigrants from Mexico (11.5%, a difference of 0.040%), Lebanese (11.5%, a difference of 0.27%), Jamaican (11.5%, a difference of 0.27%), and Immigrants from Cambodia (11.5%, a difference of 0.29%).
| Demographics | Rating | Rank | Male Disability |
| Belizeans | 21.2 /100 | #194 | Fair 11.4% |
| Immigrants | Oceania | 20.9 /100 | #195 | Fair 11.4% |
| West Indians | 18.4 /100 | #196 | Poor 11.4% |
| Somalis | 18.2 /100 | #197 | Poor 11.4% |
| Immigrants | Jamaica | 16.3 /100 | #198 | Poor 11.5% |
| Lebanese | 15.4 /100 | #199 | Poor 11.5% |
| Immigrants | Iraq | 13.0 /100 | #200 | Poor 11.5% |
| Immigrants | Panama | 13.0 /100 | #201 | Poor 11.5% |
| Immigrants | Mexico | 12.6 /100 | #202 | Poor 11.5% |
| Jamaicans | 10.9 /100 | #203 | Poor 11.5% |
| Immigrants | Cambodia | 10.8 /100 | #204 | Poor 11.5% |
| Serbians | 10.7 /100 | #205 | Poor 11.5% |
| Ukrainians | 10.6 /100 | #206 | Poor 11.5% |
| Immigrants | Somalia | 10.4 /100 | #207 | Poor 11.5% |
| Icelanders | 10.1 /100 | #208 | Poor 11.6% |