Native/Alaskan vs Immigrants from Micronesia High School Diploma
COMPARE
Native/Alaskan
Immigrants from Micronesia
High School Diploma
High School Diploma Comparison
Natives/Alaskans
Immigrants from Micronesia
85.6%
HIGH SCHOOL DIPLOMA
0.0/ 100
METRIC RATING
298th/ 347
METRIC RANK
88.6%
HIGH SCHOOL DIPLOMA
16.4/ 100
METRIC RATING
205th/ 347
METRIC RANK
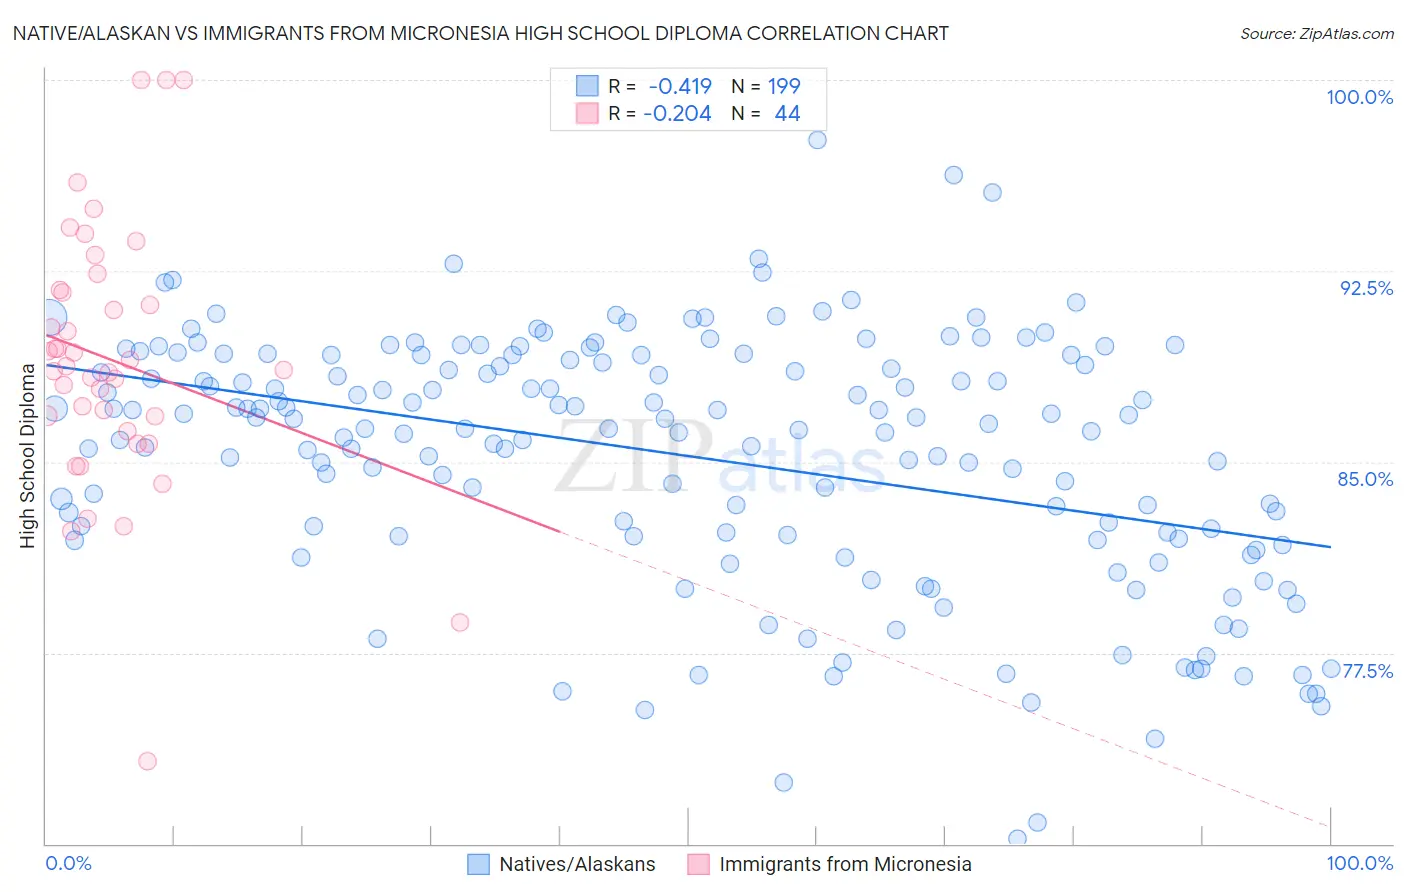
Native/Alaskan vs Immigrants from Micronesia High School Diploma Correlation Chart
The statistical analysis conducted on geographies consisting of 513,075,731 people shows a moderate negative correlation between the proportion of Natives/Alaskans and percentage of population with at least high school diploma education in the United States with a correlation coefficient (R) of -0.419 and weighted average of 85.6%. Similarly, the statistical analysis conducted on geographies consisting of 61,609,499 people shows a weak negative correlation between the proportion of Immigrants from Micronesia and percentage of population with at least high school diploma education in the United States with a correlation coefficient (R) of -0.204 and weighted average of 88.6%, a difference of 3.5%.
High School Diploma Correlation Summary
| Measurement | Native/Alaskan | Immigrants from Micronesia |
| Minimum | 70.2% | 73.2% |
| Maximum | 97.6% | 100.0% |
| Range | 27.5% | 26.8% |
| Mean | 85.2% | 89.0% |
| Median | 86.3% | 88.7% |
| Interquartile 25% (IQ1) | 82.1% | 86.5% |
| Interquartile 75% (IQ3) | 89.2% | 91.7% |
| Interquartile Range (IQR) | 7.1% | 5.2% |
| Standard Deviation (Sample) | 5.0% | 5.2% |
| Standard Deviation (Population) | 4.9% | 5.1% |
Similar Demographics by High School Diploma
Demographics Similar to Natives/Alaskans by High School Diploma
In terms of high school diploma, the demographic groups most similar to Natives/Alaskans are Immigrants from Grenada (85.6%, a difference of 0.020%), Immigrants from Cambodia (85.6%, a difference of 0.090%), Guyanese (85.5%, a difference of 0.10%), Immigrants from Bangladesh (85.5%, a difference of 0.12%), and Vietnamese (85.4%, a difference of 0.14%).
| Demographics | Rating | Rank | High School Diploma |
| Haitians | 0.0 /100 | #291 | Tragic 85.9% |
| Japanese | 0.0 /100 | #292 | Tragic 85.9% |
| British West Indians | 0.0 /100 | #293 | Tragic 85.9% |
| Immigrants | Fiji | 0.0 /100 | #294 | Tragic 85.8% |
| Immigrants | Immigrants | 0.0 /100 | #295 | Tragic 85.8% |
| Immigrants | Cambodia | 0.0 /100 | #296 | Tragic 85.6% |
| Immigrants | Grenada | 0.0 /100 | #297 | Tragic 85.6% |
| Natives/Alaskans | 0.0 /100 | #298 | Tragic 85.6% |
| Guyanese | 0.0 /100 | #299 | Tragic 85.5% |
| Immigrants | Bangladesh | 0.0 /100 | #300 | Tragic 85.5% |
| Vietnamese | 0.0 /100 | #301 | Tragic 85.4% |
| Immigrants | Haiti | 0.0 /100 | #302 | Tragic 85.4% |
| Cubans | 0.0 /100 | #303 | Tragic 85.4% |
| Nepalese | 0.0 /100 | #304 | Tragic 85.3% |
| Immigrants | Portugal | 0.0 /100 | #305 | Tragic 85.3% |
Demographics Similar to Immigrants from Micronesia by High School Diploma
In terms of high school diploma, the demographic groups most similar to Immigrants from Micronesia are Arapaho (88.6%, a difference of 0.010%), Armenian (88.6%, a difference of 0.020%), Immigrants from Sierra Leone (88.6%, a difference of 0.020%), Somali (88.6%, a difference of 0.030%), and Panamanian (88.6%, a difference of 0.040%).
| Demographics | Rating | Rank | High School Diploma |
| Liberians | 18.8 /100 | #198 | Poor 88.7% |
| Marshallese | 18.7 /100 | #199 | Poor 88.6% |
| Hawaiians | 18.3 /100 | #200 | Poor 88.6% |
| Koreans | 18.1 /100 | #201 | Poor 88.6% |
| Panamanians | 18.0 /100 | #202 | Poor 88.6% |
| Somalis | 17.5 /100 | #203 | Poor 88.6% |
| Armenians | 17.2 /100 | #204 | Poor 88.6% |
| Immigrants | Micronesia | 16.4 /100 | #205 | Poor 88.6% |
| Arapaho | 16.1 /100 | #206 | Poor 88.6% |
| Immigrants | Sierra Leone | 15.8 /100 | #207 | Poor 88.6% |
| Portuguese | 14.4 /100 | #208 | Poor 88.5% |
| Cherokee | 14.3 /100 | #209 | Poor 88.5% |
| Samoans | 14.0 /100 | #210 | Poor 88.5% |
| Inupiat | 13.1 /100 | #211 | Poor 88.5% |
| South American Indians | 12.2 /100 | #212 | Poor 88.5% |