Lumbee vs Immigrants from Ireland 4th Grade
COMPARE
Lumbee
Immigrants from Ireland
4th Grade
4th Grade Comparison
Lumbee
Immigrants from Ireland
98.0%
4TH GRADE
99.6/ 100
METRIC RATING
71st/ 347
METRIC RANK
97.9%
4TH GRADE
98.7/ 100
METRIC RATING
93rd/ 347
METRIC RANK
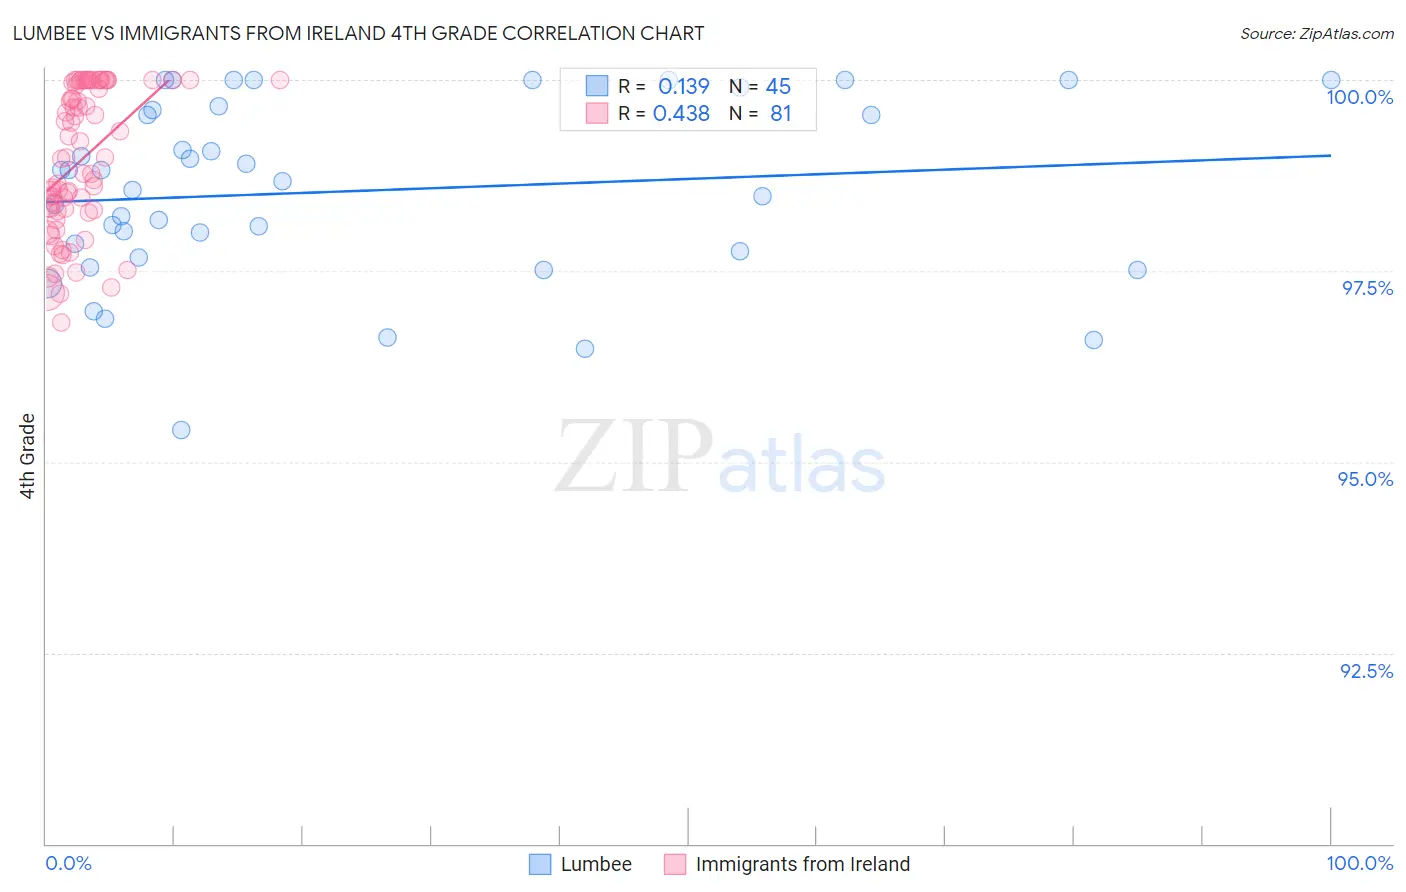
Lumbee vs Immigrants from Ireland 4th Grade Correlation Chart
The statistical analysis conducted on geographies consisting of 92,298,549 people shows a poor positive correlation between the proportion of Lumbee and percentage of population with at least 4th grade education in the United States with a correlation coefficient (R) of 0.139 and weighted average of 98.0%. Similarly, the statistical analysis conducted on geographies consisting of 240,784,498 people shows a moderate positive correlation between the proportion of Immigrants from Ireland and percentage of population with at least 4th grade education in the United States with a correlation coefficient (R) of 0.438 and weighted average of 97.9%, a difference of 0.11%.
4th Grade Correlation Summary
| Measurement | Lumbee | Immigrants from Ireland |
| Minimum | 95.4% | 96.8% |
| Maximum | 100.0% | 100.0% |
| Range | 4.6% | 3.2% |
| Mean | 98.5% | 99.0% |
| Median | 98.7% | 99.0% |
| Interquartile 25% (IQ1) | 97.7% | 98.3% |
| Interquartile 75% (IQ3) | 99.6% | 100.0% |
| Interquartile Range (IQR) | 1.9% | 1.7% |
| Standard Deviation (Sample) | 1.2% | 0.94% |
| Standard Deviation (Population) | 1.2% | 0.93% |
Similar Demographics by 4th Grade
Demographics Similar to Lumbee by 4th Grade
In terms of 4th grade, the demographic groups most similar to Lumbee are Kiowa (98.0%, a difference of 0.0%), Pueblo (98.0%, a difference of 0.0%), Immigrants from Austria (98.0%, a difference of 0.0%), Immigrants from Northern Europe (98.0%, a difference of 0.010%), and Canadian (98.0%, a difference of 0.010%).
| Demographics | Rating | Rank | 4th Grade |
| Cajuns | 99.7 /100 | #64 | Exceptional 98.0% |
| Immigrants | Northern Europe | 99.6 /100 | #65 | Exceptional 98.0% |
| Canadians | 99.6 /100 | #66 | Exceptional 98.0% |
| New Zealanders | 99.6 /100 | #67 | Exceptional 98.0% |
| Kiowa | 99.6 /100 | #68 | Exceptional 98.0% |
| Pueblo | 99.6 /100 | #69 | Exceptional 98.0% |
| Immigrants | Austria | 99.6 /100 | #70 | Exceptional 98.0% |
| Lumbee | 99.6 /100 | #71 | Exceptional 98.0% |
| Iranians | 99.4 /100 | #72 | Exceptional 98.0% |
| Macedonians | 99.4 /100 | #73 | Exceptional 98.0% |
| Chickasaw | 99.4 /100 | #74 | Exceptional 98.0% |
| Immigrants | Netherlands | 99.3 /100 | #75 | Exceptional 98.0% |
| Cherokee | 99.3 /100 | #76 | Exceptional 98.0% |
| Immigrants | Lithuania | 99.3 /100 | #77 | Exceptional 98.0% |
| Immigrants | England | 99.3 /100 | #78 | Exceptional 98.0% |
Demographics Similar to Immigrants from Ireland by 4th Grade
In terms of 4th grade, the demographic groups most similar to Immigrants from Ireland are Immigrants from South Africa (97.9%, a difference of 0.0%), Delaware (97.9%, a difference of 0.0%), Immigrants from Denmark (97.9%, a difference of 0.0%), Immigrants from Sweden (97.9%, a difference of 0.0%), and Immigrants from Western Europe (97.9%, a difference of 0.0%).
| Demographics | Rating | Rank | 4th Grade |
| Immigrants | Australia | 98.8 /100 | #86 | Exceptional 97.9% |
| Zimbabweans | 98.8 /100 | #87 | Exceptional 97.9% |
| Immigrants | South Africa | 98.8 /100 | #88 | Exceptional 97.9% |
| Delaware | 98.8 /100 | #89 | Exceptional 97.9% |
| Immigrants | Denmark | 98.7 /100 | #90 | Exceptional 97.9% |
| Immigrants | Sweden | 98.7 /100 | #91 | Exceptional 97.9% |
| Immigrants | Western Europe | 98.7 /100 | #92 | Exceptional 97.9% |
| Immigrants | Ireland | 98.7 /100 | #93 | Exceptional 97.9% |
| Shoshone | 98.7 /100 | #94 | Exceptional 97.9% |
| Immigrants | Germany | 98.5 /100 | #95 | Exceptional 97.9% |
| Romanians | 98.4 /100 | #96 | Exceptional 97.9% |
| Cheyenne | 98.4 /100 | #97 | Exceptional 97.9% |
| South Africans | 98.2 /100 | #98 | Exceptional 97.9% |
| Turks | 98.2 /100 | #99 | Exceptional 97.9% |
| Yugoslavians | 98.1 /100 | #100 | Exceptional 97.9% |