Lumbee vs Immigrants from Italy Disability Age 5 to 17
COMPARE
Lumbee
Immigrants from Italy
Disability Age 5 to 17
Disability Age 5 to 17 Comparison
Lumbee
Immigrants from Italy
6.2%
DISABILITY AGE 5 TO 17
0.0/ 100
METRIC RATING
298th/ 347
METRIC RANK
5.3%
DISABILITY AGE 5 TO 17
98.4/ 100
METRIC RATING
105th/ 347
METRIC RANK
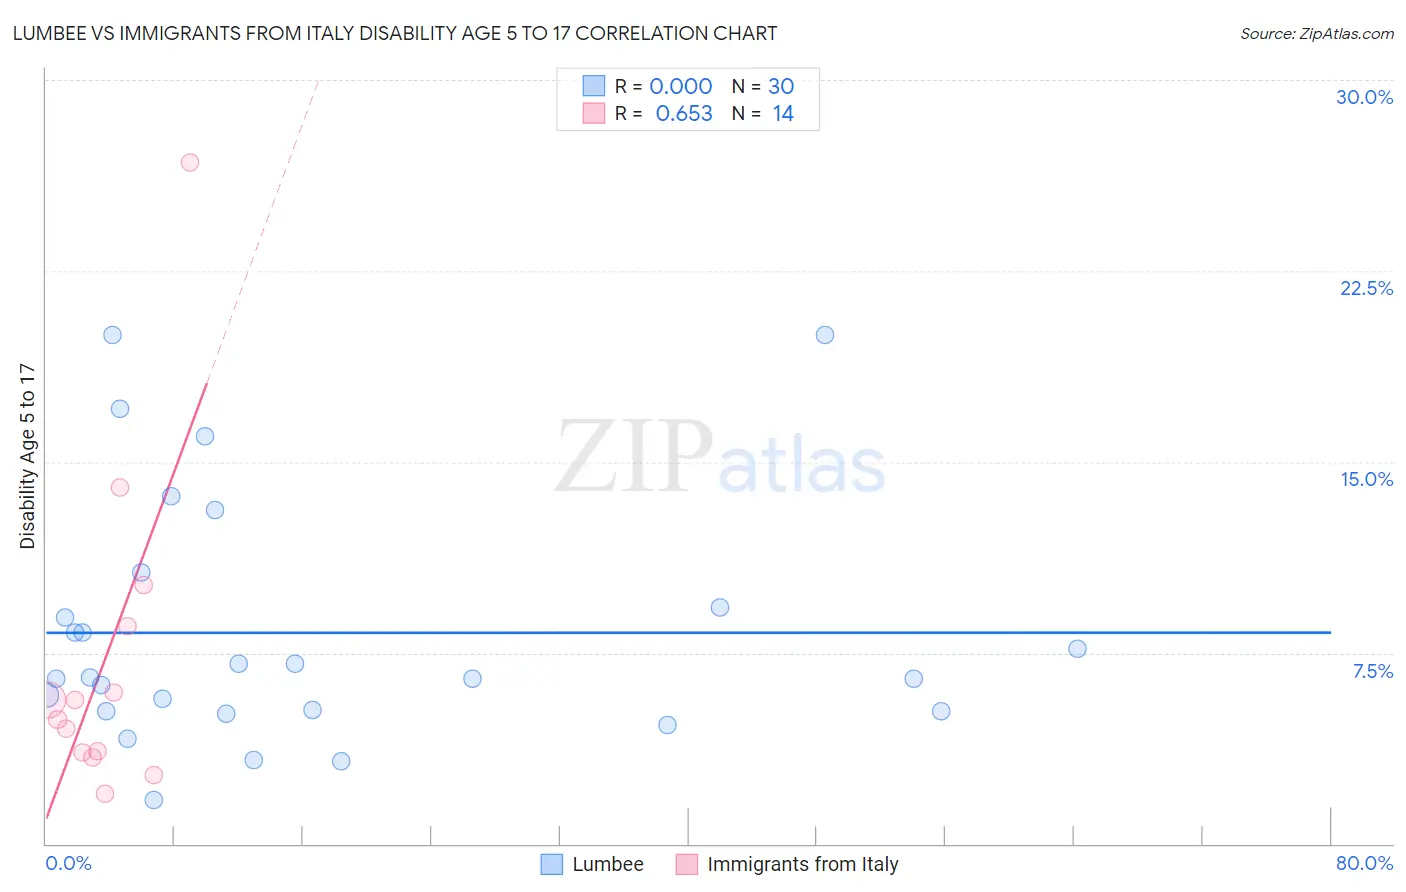
Lumbee vs Immigrants from Italy Disability Age 5 to 17 Correlation Chart
The statistical analysis conducted on geographies consisting of 92,024,510 people shows no correlation between the proportion of Lumbee and percentage of population with a disability between the ages 5 and 17 in the United States with a correlation coefficient (R) of 0.000 and weighted average of 6.2%. Similarly, the statistical analysis conducted on geographies consisting of 321,280,380 people shows a significant positive correlation between the proportion of Immigrants from Italy and percentage of population with a disability between the ages 5 and 17 in the United States with a correlation coefficient (R) of 0.653 and weighted average of 5.3%, a difference of 17.5%.
Disability Age 5 to 17 Correlation Summary
| Measurement | Lumbee | Immigrants from Italy |
| Minimum | 1.7% | 2.0% |
| Maximum | 20.0% | 26.8% |
| Range | 18.3% | 24.8% |
| Mean | 8.3% | 7.2% |
| Median | 6.5% | 5.3% |
| Interquartile 25% (IQ1) | 5.2% | 3.6% |
| Interquartile 75% (IQ3) | 9.3% | 8.6% |
| Interquartile Range (IQR) | 4.1% | 5.0% |
| Standard Deviation (Sample) | 4.8% | 6.5% |
| Standard Deviation (Population) | 4.7% | 6.3% |
Similar Demographics by Disability Age 5 to 17
Demographics Similar to Lumbee by Disability Age 5 to 17
In terms of disability age 5 to 17, the demographic groups most similar to Lumbee are Immigrants from Bahamas (6.2%, a difference of 0.070%), Welsh (6.3%, a difference of 0.15%), Spanish American (6.2%, a difference of 0.19%), Cree (6.2%, a difference of 0.22%), and Carpatho Rusyn (6.3%, a difference of 0.27%).
| Demographics | Rating | Rank | Disability Age 5 to 17 |
| Whites/Caucasians | 0.0 /100 | #291 | Tragic 6.2% |
| Immigrants | Senegal | 0.0 /100 | #292 | Tragic 6.2% |
| Central American Indians | 0.0 /100 | #293 | Tragic 6.2% |
| Irish | 0.0 /100 | #294 | Tragic 6.2% |
| Cree | 0.0 /100 | #295 | Tragic 6.2% |
| Spanish Americans | 0.0 /100 | #296 | Tragic 6.2% |
| Immigrants | Bahamas | 0.0 /100 | #297 | Tragic 6.2% |
| Lumbee | 0.0 /100 | #298 | Tragic 6.2% |
| Welsh | 0.0 /100 | #299 | Tragic 6.3% |
| Carpatho Rusyns | 0.0 /100 | #300 | Tragic 6.3% |
| U.S. Virgin Islanders | 0.0 /100 | #301 | Tragic 6.3% |
| Celtics | 0.0 /100 | #302 | Tragic 6.3% |
| Yakama | 0.0 /100 | #303 | Tragic 6.3% |
| Senegalese | 0.0 /100 | #304 | Tragic 6.3% |
| Natives/Alaskans | 0.0 /100 | #305 | Tragic 6.3% |
Demographics Similar to Immigrants from Italy by Disability Age 5 to 17
In terms of disability age 5 to 17, the demographic groups most similar to Immigrants from Italy are Peruvian (5.3%, a difference of 0.090%), Immigrants from Yemen (5.3%, a difference of 0.13%), Russian (5.3%, a difference of 0.16%), Salvadoran (5.3%, a difference of 0.17%), and Nicaraguan (5.3%, a difference of 0.19%).
| Demographics | Rating | Rank | Disability Age 5 to 17 |
| Immigrants | Austria | 98.9 /100 | #98 | Exceptional 5.3% |
| Cambodians | 98.8 /100 | #99 | Exceptional 5.3% |
| Nepalese | 98.7 /100 | #100 | Exceptional 5.3% |
| Menominee | 98.7 /100 | #101 | Exceptional 5.3% |
| Nicaraguans | 98.6 /100 | #102 | Exceptional 5.3% |
| Salvadorans | 98.6 /100 | #103 | Exceptional 5.3% |
| Peruvians | 98.5 /100 | #104 | Exceptional 5.3% |
| Immigrants | Italy | 98.4 /100 | #105 | Exceptional 5.3% |
| Immigrants | Yemen | 98.2 /100 | #106 | Exceptional 5.3% |
| Russians | 98.2 /100 | #107 | Exceptional 5.3% |
| Immigrants | South Africa | 98.1 /100 | #108 | Exceptional 5.3% |
| Immigrants | Northern Africa | 98.1 /100 | #109 | Exceptional 5.3% |
| Immigrants | Eritrea | 98.0 /100 | #110 | Exceptional 5.3% |
| Ethiopians | 97.9 /100 | #111 | Exceptional 5.3% |
| Immigrants | Latvia | 97.9 /100 | #112 | Exceptional 5.3% |