Lumbee vs Uruguayan Disability Age 5 to 17
COMPARE
Lumbee
Uruguayan
Disability Age 5 to 17
Disability Age 5 to 17 Comparison
Lumbee
Uruguayans
6.2%
DISABILITY AGE 5 TO 17
0.0/ 100
METRIC RATING
298th/ 347
METRIC RANK
5.6%
DISABILITY AGE 5 TO 17
51.0/ 100
METRIC RATING
173rd/ 347
METRIC RANK
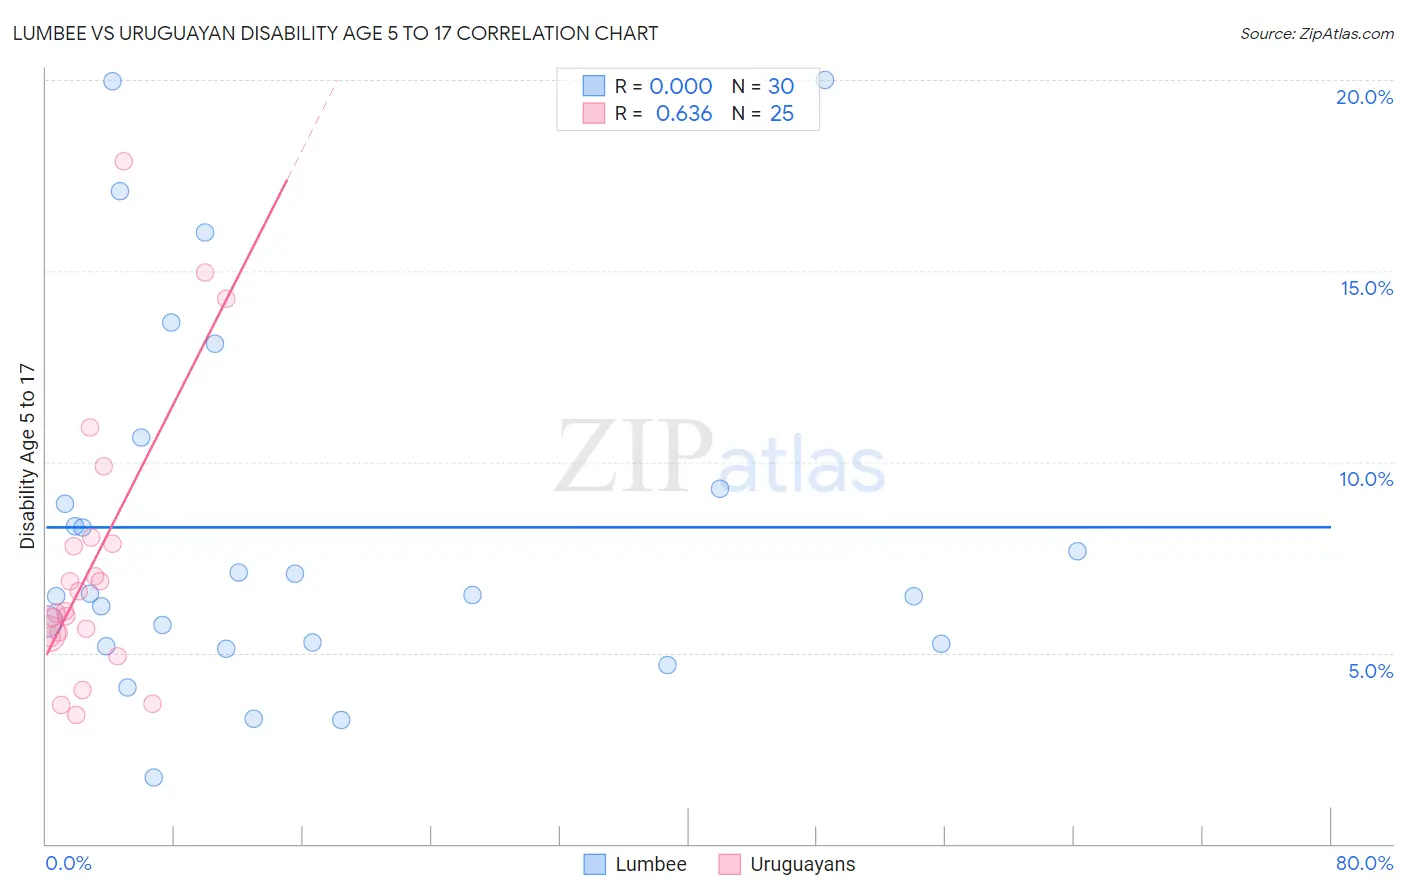
Lumbee vs Uruguayan Disability Age 5 to 17 Correlation Chart
The statistical analysis conducted on geographies consisting of 92,024,510 people shows no correlation between the proportion of Lumbee and percentage of population with a disability between the ages 5 and 17 in the United States with a correlation coefficient (R) of 0.000 and weighted average of 6.2%. Similarly, the statistical analysis conducted on geographies consisting of 144,432,233 people shows a significant positive correlation between the proportion of Uruguayans and percentage of population with a disability between the ages 5 and 17 in the United States with a correlation coefficient (R) of 0.636 and weighted average of 5.6%, a difference of 11.6%.
Disability Age 5 to 17 Correlation Summary
| Measurement | Lumbee | Uruguayan |
| Minimum | 1.7% | 3.4% |
| Maximum | 20.0% | 17.9% |
| Range | 18.3% | 14.5% |
| Mean | 8.3% | 7.4% |
| Median | 6.5% | 6.1% |
| Interquartile 25% (IQ1) | 5.2% | 5.5% |
| Interquartile 75% (IQ3) | 9.3% | 7.9% |
| Interquartile Range (IQR) | 4.1% | 2.5% |
| Standard Deviation (Sample) | 4.8% | 3.6% |
| Standard Deviation (Population) | 4.7% | 3.6% |
Similar Demographics by Disability Age 5 to 17
Demographics Similar to Lumbee by Disability Age 5 to 17
In terms of disability age 5 to 17, the demographic groups most similar to Lumbee are Immigrants from Bahamas (6.2%, a difference of 0.070%), Welsh (6.3%, a difference of 0.15%), Spanish American (6.2%, a difference of 0.19%), Cree (6.2%, a difference of 0.22%), and Carpatho Rusyn (6.3%, a difference of 0.27%).
| Demographics | Rating | Rank | Disability Age 5 to 17 |
| Whites/Caucasians | 0.0 /100 | #291 | Tragic 6.2% |
| Immigrants | Senegal | 0.0 /100 | #292 | Tragic 6.2% |
| Central American Indians | 0.0 /100 | #293 | Tragic 6.2% |
| Irish | 0.0 /100 | #294 | Tragic 6.2% |
| Cree | 0.0 /100 | #295 | Tragic 6.2% |
| Spanish Americans | 0.0 /100 | #296 | Tragic 6.2% |
| Immigrants | Bahamas | 0.0 /100 | #297 | Tragic 6.2% |
| Lumbee | 0.0 /100 | #298 | Tragic 6.2% |
| Welsh | 0.0 /100 | #299 | Tragic 6.3% |
| Carpatho Rusyns | 0.0 /100 | #300 | Tragic 6.3% |
| U.S. Virgin Islanders | 0.0 /100 | #301 | Tragic 6.3% |
| Celtics | 0.0 /100 | #302 | Tragic 6.3% |
| Yakama | 0.0 /100 | #303 | Tragic 6.3% |
| Senegalese | 0.0 /100 | #304 | Tragic 6.3% |
| Natives/Alaskans | 0.0 /100 | #305 | Tragic 6.3% |
Demographics Similar to Uruguayans by Disability Age 5 to 17
In terms of disability age 5 to 17, the demographic groups most similar to Uruguayans are Ukrainian (5.6%, a difference of 0.030%), Costa Rican (5.6%, a difference of 0.050%), Shoshone (5.6%, a difference of 0.080%), Immigrants from Central America (5.6%, a difference of 0.080%), and Serbian (5.6%, a difference of 0.15%).
| Demographics | Rating | Rank | Disability Age 5 to 17 |
| Greeks | 60.6 /100 | #166 | Good 5.6% |
| Immigrants | Burma/Myanmar | 59.3 /100 | #167 | Average 5.6% |
| Iraqis | 56.0 /100 | #168 | Average 5.6% |
| Immigrants | Norway | 55.7 /100 | #169 | Average 5.6% |
| Serbians | 54.0 /100 | #170 | Average 5.6% |
| Immigrants | Iraq | 53.9 /100 | #171 | Average 5.6% |
| Ukrainians | 51.5 /100 | #172 | Average 5.6% |
| Uruguayans | 51.0 /100 | #173 | Average 5.6% |
| Costa Ricans | 50.0 /100 | #174 | Average 5.6% |
| Shoshone | 49.4 /100 | #175 | Average 5.6% |
| Immigrants | Central America | 49.4 /100 | #176 | Average 5.6% |
| Immigrants | Western Europe | 47.8 /100 | #177 | Average 5.6% |
| Immigrants | Trinidad and Tobago | 47.6 /100 | #178 | Average 5.6% |
| Immigrants | Barbados | 40.5 /100 | #179 | Average 5.6% |
| Immigrants | Uruguay | 37.7 /100 | #180 | Fair 5.6% |