Latvian vs Pima Ambulatory Disability
COMPARE
Latvian
Pima
Ambulatory Disability
Ambulatory Disability Comparison
Latvians
Pima
5.7%
AMBULATORY DISABILITY
99.0/ 100
METRIC RATING
86th/ 347
METRIC RANK
8.2%
AMBULATORY DISABILITY
0.0/ 100
METRIC RATING
339th/ 347
METRIC RANK
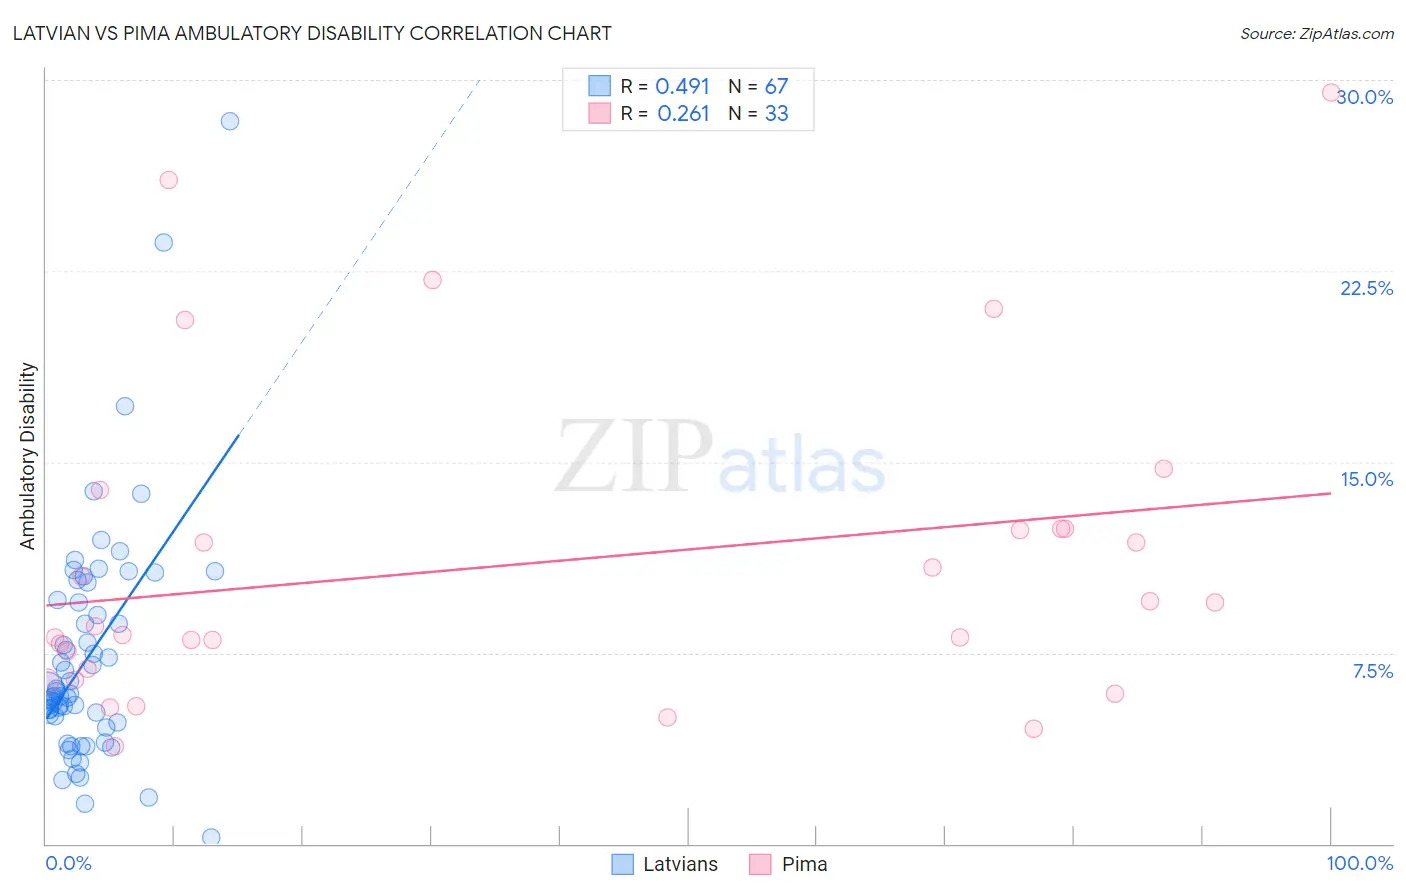
Latvian vs Pima Ambulatory Disability Correlation Chart
The statistical analysis conducted on geographies consisting of 220,706,558 people shows a moderate positive correlation between the proportion of Latvians and percentage of population with ambulatory disability in the United States with a correlation coefficient (R) of 0.491 and weighted average of 5.7%. Similarly, the statistical analysis conducted on geographies consisting of 61,538,415 people shows a weak positive correlation between the proportion of Pima and percentage of population with ambulatory disability in the United States with a correlation coefficient (R) of 0.261 and weighted average of 8.2%, a difference of 43.5%.
Ambulatory Disability Correlation Summary
| Measurement | Latvian | Pima |
| Minimum | 0.23% | 3.8% |
| Maximum | 28.4% | 29.5% |
| Range | 28.1% | 25.7% |
| Mean | 7.3% | 11.0% |
| Median | 5.9% | 8.6% |
| Interquartile 25% (IQ1) | 4.8% | 6.7% |
| Interquartile 75% (IQ3) | 9.6% | 12.4% |
| Interquartile Range (IQR) | 4.8% | 5.7% |
| Standard Deviation (Sample) | 4.6% | 6.3% |
| Standard Deviation (Population) | 4.6% | 6.2% |
Similar Demographics by Ambulatory Disability
Demographics Similar to Latvians by Ambulatory Disability
In terms of ambulatory disability, the demographic groups most similar to Latvians are South American (5.7%, a difference of 0.030%), Immigrants from Chile (5.8%, a difference of 0.060%), Soviet Union (5.8%, a difference of 0.11%), Bhutanese (5.8%, a difference of 0.23%), and Australian (5.8%, a difference of 0.23%).
| Demographics | Rating | Rank | Ambulatory Disability |
| Chileans | 99.2 /100 | #79 | Exceptional 5.7% |
| Immigrants | Ireland | 99.2 /100 | #80 | Exceptional 5.7% |
| Immigrants | Jordan | 99.2 /100 | #81 | Exceptional 5.7% |
| Palestinians | 99.2 /100 | #82 | Exceptional 5.7% |
| Eastern Europeans | 99.2 /100 | #83 | Exceptional 5.7% |
| Ugandans | 99.2 /100 | #84 | Exceptional 5.7% |
| South Americans | 99.0 /100 | #85 | Exceptional 5.7% |
| Latvians | 99.0 /100 | #86 | Exceptional 5.7% |
| Immigrants | Chile | 98.9 /100 | #87 | Exceptional 5.8% |
| Soviet Union | 98.9 /100 | #88 | Exceptional 5.8% |
| Bhutanese | 98.8 /100 | #89 | Exceptional 5.8% |
| Australians | 98.8 /100 | #90 | Exceptional 5.8% |
| Immigrants | Sudan | 98.8 /100 | #91 | Exceptional 5.8% |
| Immigrants | Sierra Leone | 98.6 /100 | #92 | Exceptional 5.8% |
| Immigrants | Denmark | 98.6 /100 | #93 | Exceptional 5.8% |
Demographics Similar to Pima by Ambulatory Disability
In terms of ambulatory disability, the demographic groups most similar to Pima are Colville (8.2%, a difference of 0.35%), Choctaw (8.3%, a difference of 0.83%), Dutch West Indian (8.2%, a difference of 0.92%), Creek (8.5%, a difference of 2.5%), and Seminole (8.0%, a difference of 2.6%).
| Demographics | Rating | Rank | Ambulatory Disability |
| Menominee | 0.0 /100 | #332 | Tragic 7.8% |
| Cherokee | 0.0 /100 | #333 | Tragic 7.9% |
| Yuman | 0.0 /100 | #334 | Tragic 7.9% |
| Chickasaw | 0.0 /100 | #335 | Tragic 8.0% |
| Seminole | 0.0 /100 | #336 | Tragic 8.0% |
| Dutch West Indians | 0.0 /100 | #337 | Tragic 8.2% |
| Colville | 0.0 /100 | #338 | Tragic 8.2% |
| Pima | 0.0 /100 | #339 | Tragic 8.2% |
| Choctaw | 0.0 /100 | #340 | Tragic 8.3% |
| Creek | 0.0 /100 | #341 | Tragic 8.5% |
| Kiowa | 0.0 /100 | #342 | Tragic 8.6% |
| Tohono O'odham | 0.0 /100 | #343 | Tragic 8.7% |
| Tsimshian | 0.0 /100 | #344 | Tragic 8.8% |
| Puerto Ricans | 0.0 /100 | #345 | Tragic 8.9% |
| Houma | 0.0 /100 | #346 | Tragic 9.3% |