Latvian vs Immigrants from Uganda Ambulatory Disability
COMPARE
Latvian
Immigrants from Uganda
Ambulatory Disability
Ambulatory Disability Comparison
Latvians
Immigrants from Uganda
5.7%
AMBULATORY DISABILITY
99.0/ 100
METRIC RATING
86th/ 347
METRIC RANK
5.7%
AMBULATORY DISABILITY
99.6/ 100
METRIC RATING
67th/ 347
METRIC RANK
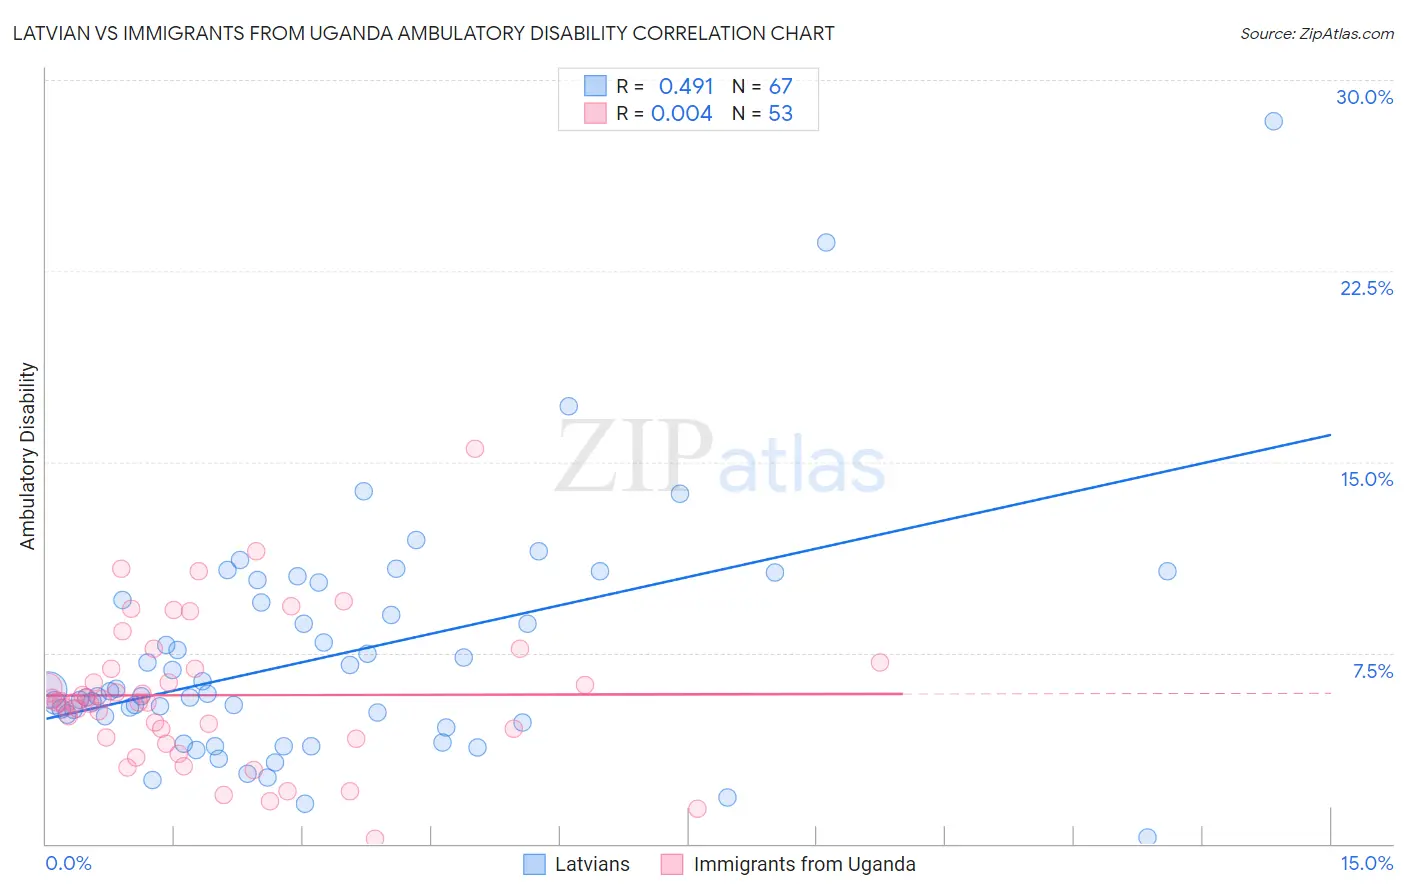
Latvian vs Immigrants from Uganda Ambulatory Disability Correlation Chart
The statistical analysis conducted on geographies consisting of 220,706,558 people shows a moderate positive correlation between the proportion of Latvians and percentage of population with ambulatory disability in the United States with a correlation coefficient (R) of 0.491 and weighted average of 5.7%. Similarly, the statistical analysis conducted on geographies consisting of 125,972,414 people shows no correlation between the proportion of Immigrants from Uganda and percentage of population with ambulatory disability in the United States with a correlation coefficient (R) of 0.004 and weighted average of 5.7%, a difference of 1.5%.
Ambulatory Disability Correlation Summary
| Measurement | Latvian | Immigrants from Uganda |
| Minimum | 0.23% | 0.18% |
| Maximum | 28.4% | 15.5% |
| Range | 28.1% | 15.3% |
| Mean | 7.3% | 5.8% |
| Median | 5.9% | 5.6% |
| Interquartile 25% (IQ1) | 4.8% | 4.1% |
| Interquartile 75% (IQ3) | 9.6% | 7.0% |
| Interquartile Range (IQR) | 4.8% | 2.9% |
| Standard Deviation (Sample) | 4.6% | 2.8% |
| Standard Deviation (Population) | 4.6% | 2.8% |
Demographics Similar to Latvians and Immigrants from Uganda by Ambulatory Disability
In terms of ambulatory disability, the demographic groups most similar to Latvians are South American (5.7%, a difference of 0.030%), Ugandan (5.7%, a difference of 0.27%), Eastern European (5.7%, a difference of 0.28%), Palestinian (5.7%, a difference of 0.29%), and Immigrants from Jordan (5.7%, a difference of 0.30%). Similarly, the demographic groups most similar to Immigrants from Uganda are Israeli (5.7%, a difference of 0.010%), Sri Lankan (5.7%, a difference of 0.030%), Peruvian (5.7%, a difference of 0.46%), Sierra Leonean (5.7%, a difference of 0.69%), and Immigrants from Peru (5.7%, a difference of 0.78%).
| Demographics | Rating | Rank | Ambulatory Disability |
| Israelis | 99.6 /100 | #66 | Exceptional 5.7% |
| Immigrants | Uganda | 99.6 /100 | #67 | Exceptional 5.7% |
| Sri Lankans | 99.6 /100 | #68 | Exceptional 5.7% |
| Peruvians | 99.5 /100 | #69 | Exceptional 5.7% |
| Sierra Leoneans | 99.4 /100 | #70 | Exceptional 5.7% |
| Immigrants | Peru | 99.4 /100 | #71 | Exceptional 5.7% |
| Brazilians | 99.4 /100 | #72 | Exceptional 5.7% |
| Immigrants | Northern Africa | 99.4 /100 | #73 | Exceptional 5.7% |
| Immigrants | Cameroon | 99.4 /100 | #74 | Exceptional 5.7% |
| Immigrants | South Africa | 99.3 /100 | #75 | Exceptional 5.7% |
| Sudanese | 99.3 /100 | #76 | Exceptional 5.7% |
| Immigrants | Vietnam | 99.3 /100 | #77 | Exceptional 5.7% |
| Somalis | 99.2 /100 | #78 | Exceptional 5.7% |
| Chileans | 99.2 /100 | #79 | Exceptional 5.7% |
| Immigrants | Ireland | 99.2 /100 | #80 | Exceptional 5.7% |
| Immigrants | Jordan | 99.2 /100 | #81 | Exceptional 5.7% |
| Palestinians | 99.2 /100 | #82 | Exceptional 5.7% |
| Eastern Europeans | 99.2 /100 | #83 | Exceptional 5.7% |
| Ugandans | 99.2 /100 | #84 | Exceptional 5.7% |
| South Americans | 99.0 /100 | #85 | Exceptional 5.7% |
| Latvians | 99.0 /100 | #86 | Exceptional 5.7% |