Ecuadorian vs Pima Ambulatory Disability
COMPARE
Ecuadorian
Pima
Ambulatory Disability
Ambulatory Disability Comparison
Ecuadorians
Pima
6.1%
AMBULATORY DISABILITY
60.5/ 100
METRIC RATING
168th/ 347
METRIC RANK
8.2%
AMBULATORY DISABILITY
0.0/ 100
METRIC RATING
339th/ 347
METRIC RANK
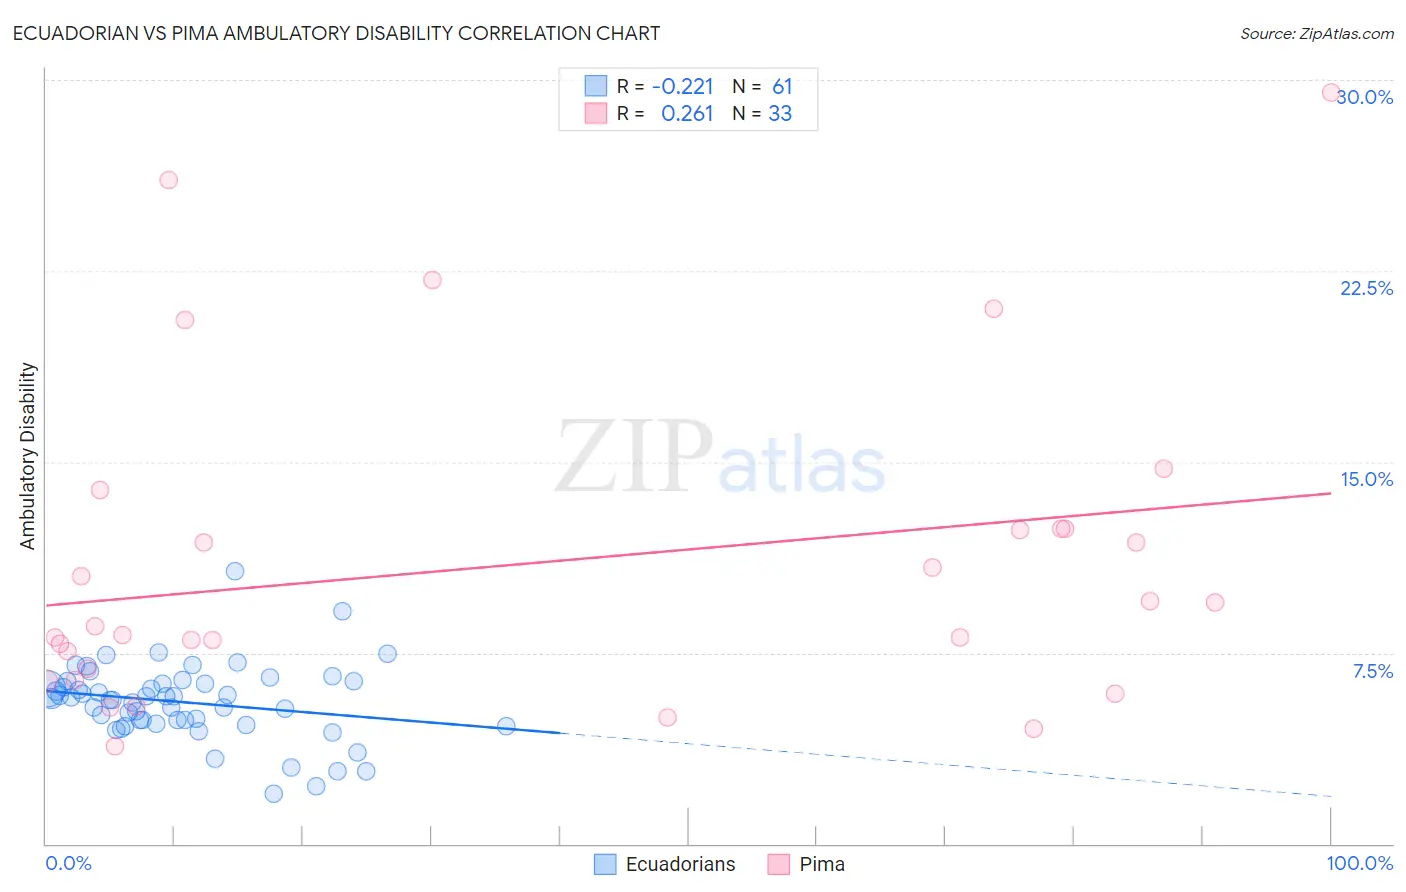
Ecuadorian vs Pima Ambulatory Disability Correlation Chart
The statistical analysis conducted on geographies consisting of 317,738,990 people shows a weak negative correlation between the proportion of Ecuadorians and percentage of population with ambulatory disability in the United States with a correlation coefficient (R) of -0.221 and weighted average of 6.1%. Similarly, the statistical analysis conducted on geographies consisting of 61,538,415 people shows a weak positive correlation between the proportion of Pima and percentage of population with ambulatory disability in the United States with a correlation coefficient (R) of 0.261 and weighted average of 8.2%, a difference of 35.5%.
Ambulatory Disability Correlation Summary
| Measurement | Ecuadorian | Pima |
| Minimum | 1.9% | 3.8% |
| Maximum | 10.7% | 29.5% |
| Range | 8.8% | 25.7% |
| Mean | 5.6% | 11.0% |
| Median | 5.7% | 8.6% |
| Interquartile 25% (IQ1) | 4.8% | 6.7% |
| Interquartile 75% (IQ3) | 6.3% | 12.4% |
| Interquartile Range (IQR) | 1.6% | 5.7% |
| Standard Deviation (Sample) | 1.5% | 6.3% |
| Standard Deviation (Population) | 1.5% | 6.2% |
Similar Demographics by Ambulatory Disability
Demographics Similar to Ecuadorians by Ambulatory Disability
In terms of ambulatory disability, the demographic groups most similar to Ecuadorians are Immigrants from Oceania (6.1%, a difference of 0.010%), Iraqi (6.1%, a difference of 0.13%), Immigrants from Southern Europe (6.1%, a difference of 0.14%), Nicaraguan (6.1%, a difference of 0.15%), and Basque (6.1%, a difference of 0.18%).
| Demographics | Rating | Rank | Ambulatory Disability |
| Immigrants | Belarus | 69.2 /100 | #161 | Good 6.1% |
| Nigerians | 67.1 /100 | #162 | Good 6.1% |
| Lebanese | 66.2 /100 | #163 | Good 6.1% |
| Basques | 63.7 /100 | #164 | Good 6.1% |
| Nicaraguans | 63.2 /100 | #165 | Good 6.1% |
| Iraqis | 62.8 /100 | #166 | Good 6.1% |
| Immigrants | Oceania | 60.7 /100 | #167 | Good 6.1% |
| Ecuadorians | 60.5 /100 | #168 | Good 6.1% |
| Immigrants | Southern Europe | 58.1 /100 | #169 | Average 6.1% |
| Immigrants | Ecuador | 53.8 /100 | #170 | Average 6.1% |
| Moroccans | 52.6 /100 | #171 | Average 6.1% |
| Immigrants | Burma/Myanmar | 52.2 /100 | #172 | Average 6.1% |
| Croatians | 51.2 /100 | #173 | Average 6.1% |
| Immigrants | Canada | 50.0 /100 | #174 | Average 6.1% |
| Vietnamese | 47.2 /100 | #175 | Average 6.1% |
Demographics Similar to Pima by Ambulatory Disability
In terms of ambulatory disability, the demographic groups most similar to Pima are Colville (8.2%, a difference of 0.35%), Choctaw (8.3%, a difference of 0.83%), Dutch West Indian (8.2%, a difference of 0.92%), Creek (8.5%, a difference of 2.5%), and Seminole (8.0%, a difference of 2.6%).
| Demographics | Rating | Rank | Ambulatory Disability |
| Menominee | 0.0 /100 | #332 | Tragic 7.8% |
| Cherokee | 0.0 /100 | #333 | Tragic 7.9% |
| Yuman | 0.0 /100 | #334 | Tragic 7.9% |
| Chickasaw | 0.0 /100 | #335 | Tragic 8.0% |
| Seminole | 0.0 /100 | #336 | Tragic 8.0% |
| Dutch West Indians | 0.0 /100 | #337 | Tragic 8.2% |
| Colville | 0.0 /100 | #338 | Tragic 8.2% |
| Pima | 0.0 /100 | #339 | Tragic 8.2% |
| Choctaw | 0.0 /100 | #340 | Tragic 8.3% |
| Creek | 0.0 /100 | #341 | Tragic 8.5% |
| Kiowa | 0.0 /100 | #342 | Tragic 8.6% |
| Tohono O'odham | 0.0 /100 | #343 | Tragic 8.7% |
| Tsimshian | 0.0 /100 | #344 | Tragic 8.8% |
| Puerto Ricans | 0.0 /100 | #345 | Tragic 8.9% |
| Houma | 0.0 /100 | #346 | Tragic 9.3% |