Latvian vs Marshallese Ambulatory Disability
COMPARE
Latvian
Marshallese
Ambulatory Disability
Ambulatory Disability Comparison
Latvians
Marshallese
5.7%
AMBULATORY DISABILITY
99.0/ 100
METRIC RATING
86th/ 347
METRIC RANK
6.9%
AMBULATORY DISABILITY
0.0/ 100
METRIC RATING
300th/ 347
METRIC RANK
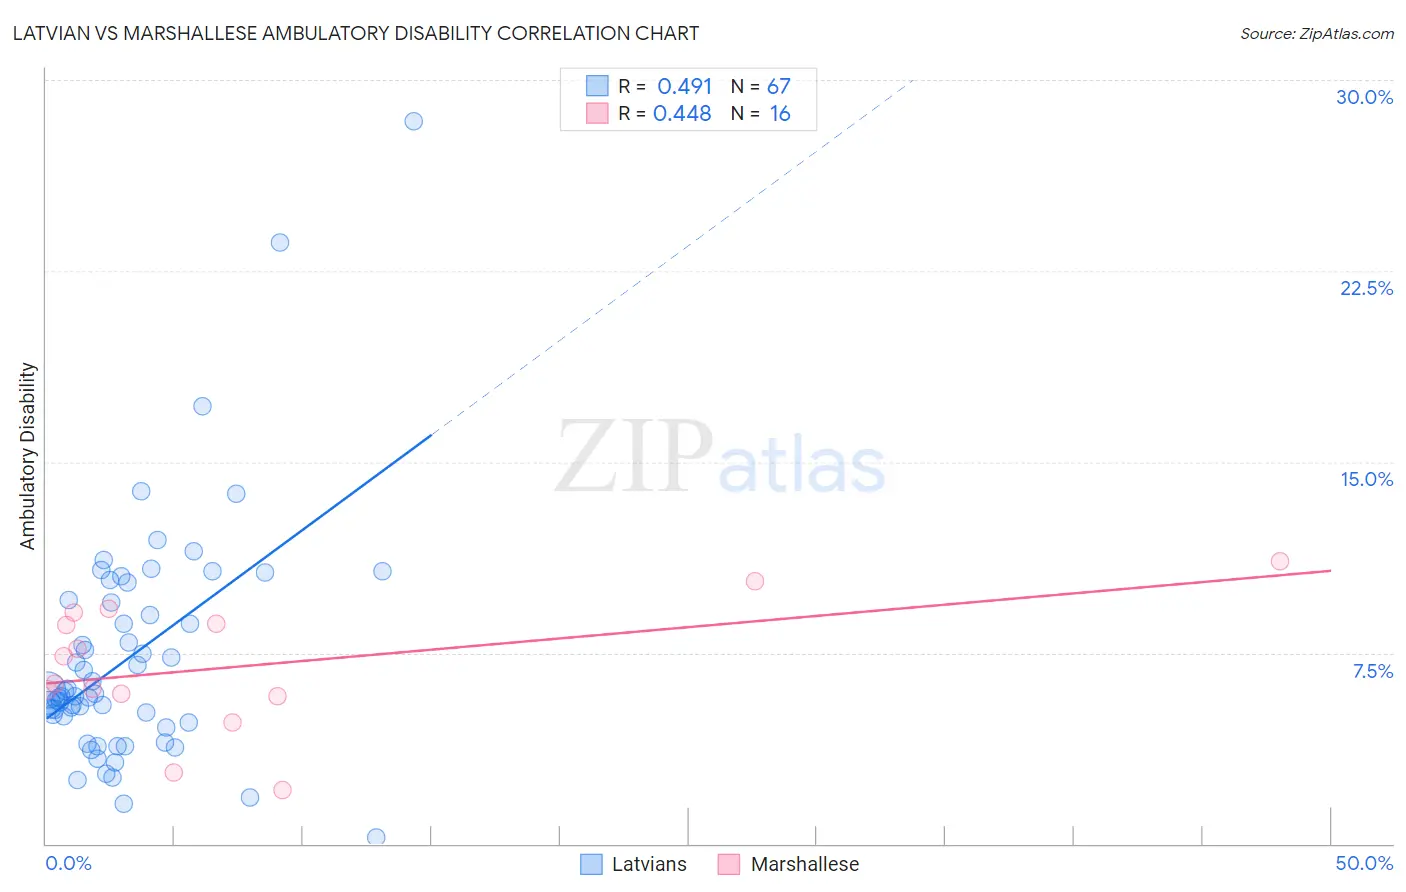
Latvian vs Marshallese Ambulatory Disability Correlation Chart
The statistical analysis conducted on geographies consisting of 220,706,558 people shows a moderate positive correlation between the proportion of Latvians and percentage of population with ambulatory disability in the United States with a correlation coefficient (R) of 0.491 and weighted average of 5.7%. Similarly, the statistical analysis conducted on geographies consisting of 14,761,315 people shows a moderate positive correlation between the proportion of Marshallese and percentage of population with ambulatory disability in the United States with a correlation coefficient (R) of 0.448 and weighted average of 6.9%, a difference of 20.9%.
Ambulatory Disability Correlation Summary
| Measurement | Latvian | Marshallese |
| Minimum | 0.23% | 2.1% |
| Maximum | 28.4% | 11.1% |
| Range | 28.1% | 9.0% |
| Mean | 7.3% | 7.0% |
| Median | 5.9% | 6.8% |
| Interquartile 25% (IQ1) | 4.8% | 5.8% |
| Interquartile 75% (IQ3) | 9.6% | 8.9% |
| Interquartile Range (IQR) | 4.8% | 3.0% |
| Standard Deviation (Sample) | 4.6% | 2.5% |
| Standard Deviation (Population) | 4.6% | 2.4% |
Similar Demographics by Ambulatory Disability
Demographics Similar to Latvians by Ambulatory Disability
In terms of ambulatory disability, the demographic groups most similar to Latvians are South American (5.7%, a difference of 0.030%), Immigrants from Chile (5.8%, a difference of 0.060%), Soviet Union (5.8%, a difference of 0.11%), Bhutanese (5.8%, a difference of 0.23%), and Australian (5.8%, a difference of 0.23%).
| Demographics | Rating | Rank | Ambulatory Disability |
| Chileans | 99.2 /100 | #79 | Exceptional 5.7% |
| Immigrants | Ireland | 99.2 /100 | #80 | Exceptional 5.7% |
| Immigrants | Jordan | 99.2 /100 | #81 | Exceptional 5.7% |
| Palestinians | 99.2 /100 | #82 | Exceptional 5.7% |
| Eastern Europeans | 99.2 /100 | #83 | Exceptional 5.7% |
| Ugandans | 99.2 /100 | #84 | Exceptional 5.7% |
| South Americans | 99.0 /100 | #85 | Exceptional 5.7% |
| Latvians | 99.0 /100 | #86 | Exceptional 5.7% |
| Immigrants | Chile | 98.9 /100 | #87 | Exceptional 5.8% |
| Soviet Union | 98.9 /100 | #88 | Exceptional 5.8% |
| Bhutanese | 98.8 /100 | #89 | Exceptional 5.8% |
| Australians | 98.8 /100 | #90 | Exceptional 5.8% |
| Immigrants | Sudan | 98.8 /100 | #91 | Exceptional 5.8% |
| Immigrants | Sierra Leone | 98.6 /100 | #92 | Exceptional 5.8% |
| Immigrants | Denmark | 98.6 /100 | #93 | Exceptional 5.8% |
Demographics Similar to Marshallese by Ambulatory Disability
In terms of ambulatory disability, the demographic groups most similar to Marshallese are Puget Sound Salish (6.9%, a difference of 0.010%), Immigrants from Grenada (6.9%, a difference of 0.14%), French American Indian (6.9%, a difference of 0.15%), British West Indian (7.0%, a difference of 0.23%), and Immigrants from Armenia (7.0%, a difference of 0.28%).
| Demographics | Rating | Rank | Ambulatory Disability |
| Immigrants | St. Vincent and the Grenadines | 0.0 /100 | #293 | Tragic 6.9% |
| Cape Verdeans | 0.0 /100 | #294 | Tragic 6.9% |
| Crow | 0.0 /100 | #295 | Tragic 6.9% |
| Alaskan Athabascans | 0.0 /100 | #296 | Tragic 6.9% |
| French American Indians | 0.0 /100 | #297 | Tragic 6.9% |
| Immigrants | Grenada | 0.0 /100 | #298 | Tragic 6.9% |
| Puget Sound Salish | 0.0 /100 | #299 | Tragic 6.9% |
| Marshallese | 0.0 /100 | #300 | Tragic 6.9% |
| British West Indians | 0.0 /100 | #301 | Tragic 7.0% |
| Immigrants | Armenia | 0.0 /100 | #302 | Tragic 7.0% |
| Africans | 0.0 /100 | #303 | Tragic 7.0% |
| Immigrants | Cabo Verde | 0.0 /100 | #304 | Tragic 7.0% |
| Immigrants | Micronesia | 0.0 /100 | #305 | Tragic 7.0% |
| Iroquois | 0.0 /100 | #306 | Tragic 7.1% |
| Spanish Americans | 0.0 /100 | #307 | Tragic 7.1% |