Latvian vs Immigrants from Czechoslovakia Ambulatory Disability
COMPARE
Latvian
Immigrants from Czechoslovakia
Ambulatory Disability
Ambulatory Disability Comparison
Latvians
Immigrants from Czechoslovakia
5.7%
AMBULATORY DISABILITY
99.0/ 100
METRIC RATING
86th/ 347
METRIC RANK
5.8%
AMBULATORY DISABILITY
97.4/ 100
METRIC RATING
105th/ 347
METRIC RANK
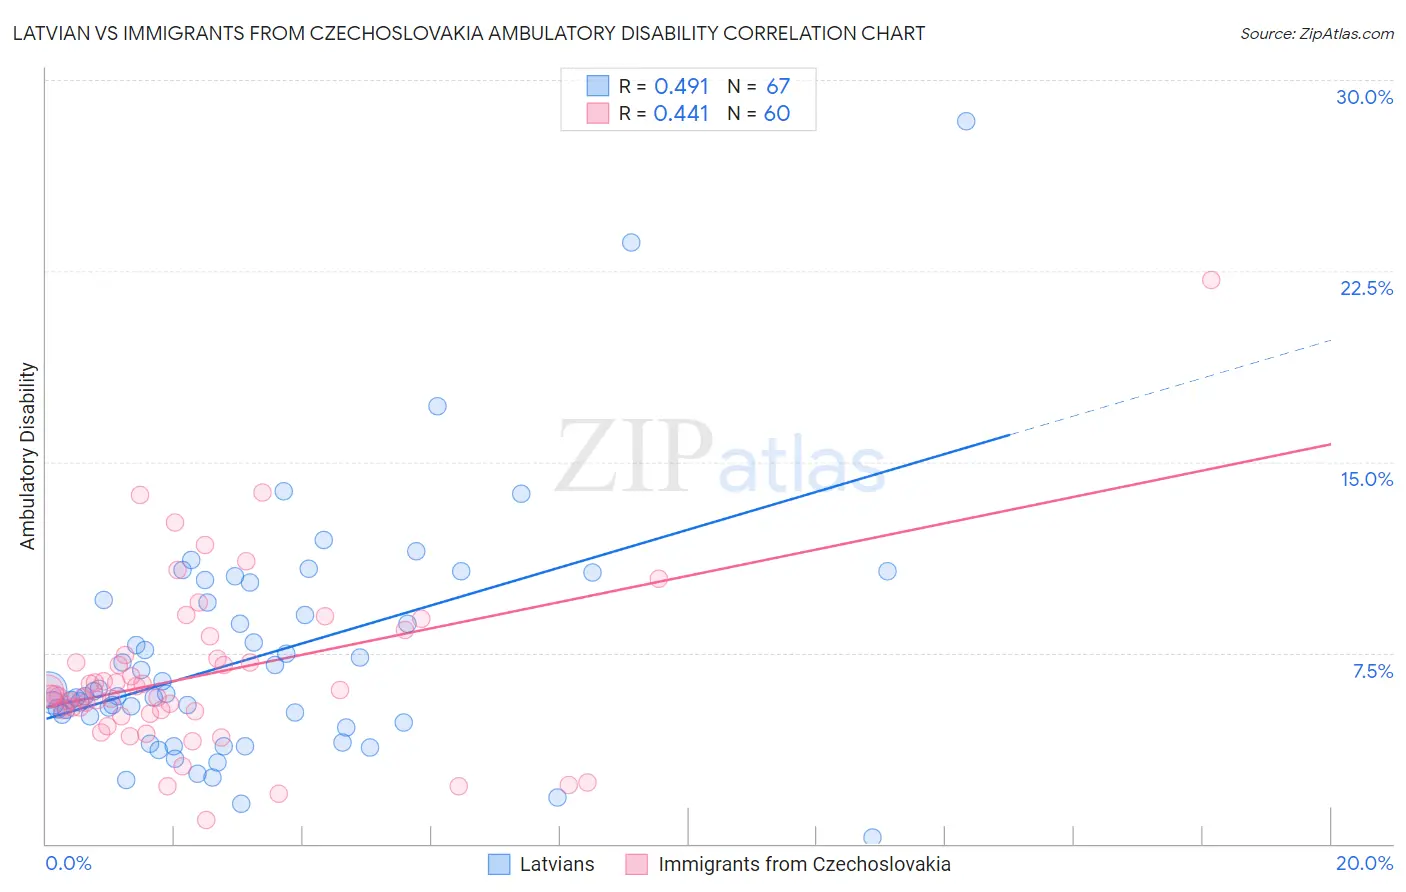
Latvian vs Immigrants from Czechoslovakia Ambulatory Disability Correlation Chart
The statistical analysis conducted on geographies consisting of 220,706,558 people shows a moderate positive correlation between the proportion of Latvians and percentage of population with ambulatory disability in the United States with a correlation coefficient (R) of 0.491 and weighted average of 5.7%. Similarly, the statistical analysis conducted on geographies consisting of 195,441,857 people shows a moderate positive correlation between the proportion of Immigrants from Czechoslovakia and percentage of population with ambulatory disability in the United States with a correlation coefficient (R) of 0.441 and weighted average of 5.8%, a difference of 1.3%.
Ambulatory Disability Correlation Summary
| Measurement | Latvian | Immigrants from Czechoslovakia |
| Minimum | 0.23% | 0.95% |
| Maximum | 28.4% | 22.2% |
| Range | 28.1% | 21.2% |
| Mean | 7.3% | 6.6% |
| Median | 5.9% | 5.8% |
| Interquartile 25% (IQ1) | 4.8% | 5.2% |
| Interquartile 75% (IQ3) | 9.6% | 7.4% |
| Interquartile Range (IQR) | 4.8% | 2.2% |
| Standard Deviation (Sample) | 4.6% | 3.4% |
| Standard Deviation (Population) | 4.6% | 3.4% |
Demographics Similar to Latvians and Immigrants from Czechoslovakia by Ambulatory Disability
In terms of ambulatory disability, the demographic groups most similar to Latvians are South American (5.7%, a difference of 0.030%), Immigrants from Chile (5.8%, a difference of 0.060%), Soviet Union (5.8%, a difference of 0.11%), Bhutanese (5.8%, a difference of 0.23%), and Australian (5.8%, a difference of 0.23%). Similarly, the demographic groups most similar to Immigrants from Czechoslovakia are New Zealander (5.8%, a difference of 0.11%), Immigrants from Romania (5.8%, a difference of 0.17%), Immigrants from Kenya (5.8%, a difference of 0.24%), Immigrants from Serbia (5.8%, a difference of 0.32%), and Immigrants from South America (5.8%, a difference of 0.32%).
| Demographics | Rating | Rank | Ambulatory Disability |
| South Americans | 99.0 /100 | #85 | Exceptional 5.7% |
| Latvians | 99.0 /100 | #86 | Exceptional 5.7% |
| Immigrants | Chile | 98.9 /100 | #87 | Exceptional 5.8% |
| Soviet Union | 98.9 /100 | #88 | Exceptional 5.8% |
| Bhutanese | 98.8 /100 | #89 | Exceptional 5.8% |
| Australians | 98.8 /100 | #90 | Exceptional 5.8% |
| Immigrants | Sudan | 98.8 /100 | #91 | Exceptional 5.8% |
| Immigrants | Sierra Leone | 98.6 /100 | #92 | Exceptional 5.8% |
| Immigrants | Denmark | 98.6 /100 | #93 | Exceptional 5.8% |
| Kenyans | 98.4 /100 | #94 | Exceptional 5.8% |
| Immigrants | El Salvador | 98.4 /100 | #95 | Exceptional 5.8% |
| Salvadorans | 98.4 /100 | #96 | Exceptional 5.8% |
| Immigrants | Somalia | 98.3 /100 | #97 | Exceptional 5.8% |
| Immigrants | Lebanon | 98.3 /100 | #98 | Exceptional 5.8% |
| Immigrants | Northern Europe | 98.2 /100 | #99 | Exceptional 5.8% |
| Immigrants | Serbia | 97.9 /100 | #100 | Exceptional 5.8% |
| Immigrants | South America | 97.9 /100 | #101 | Exceptional 5.8% |
| Immigrants | Kenya | 97.8 /100 | #102 | Exceptional 5.8% |
| Immigrants | Romania | 97.7 /100 | #103 | Exceptional 5.8% |
| New Zealanders | 97.6 /100 | #104 | Exceptional 5.8% |
| Immigrants | Czechoslovakia | 97.4 /100 | #105 | Exceptional 5.8% |