Immigrants from Albania vs Pima Ambulatory Disability
COMPARE
Immigrants from Albania
Pima
Ambulatory Disability
Ambulatory Disability Comparison
Immigrants from Albania
Pima
6.3%
AMBULATORY DISABILITY
9.6/ 100
METRIC RATING
220th/ 347
METRIC RANK
8.2%
AMBULATORY DISABILITY
0.0/ 100
METRIC RATING
339th/ 347
METRIC RANK
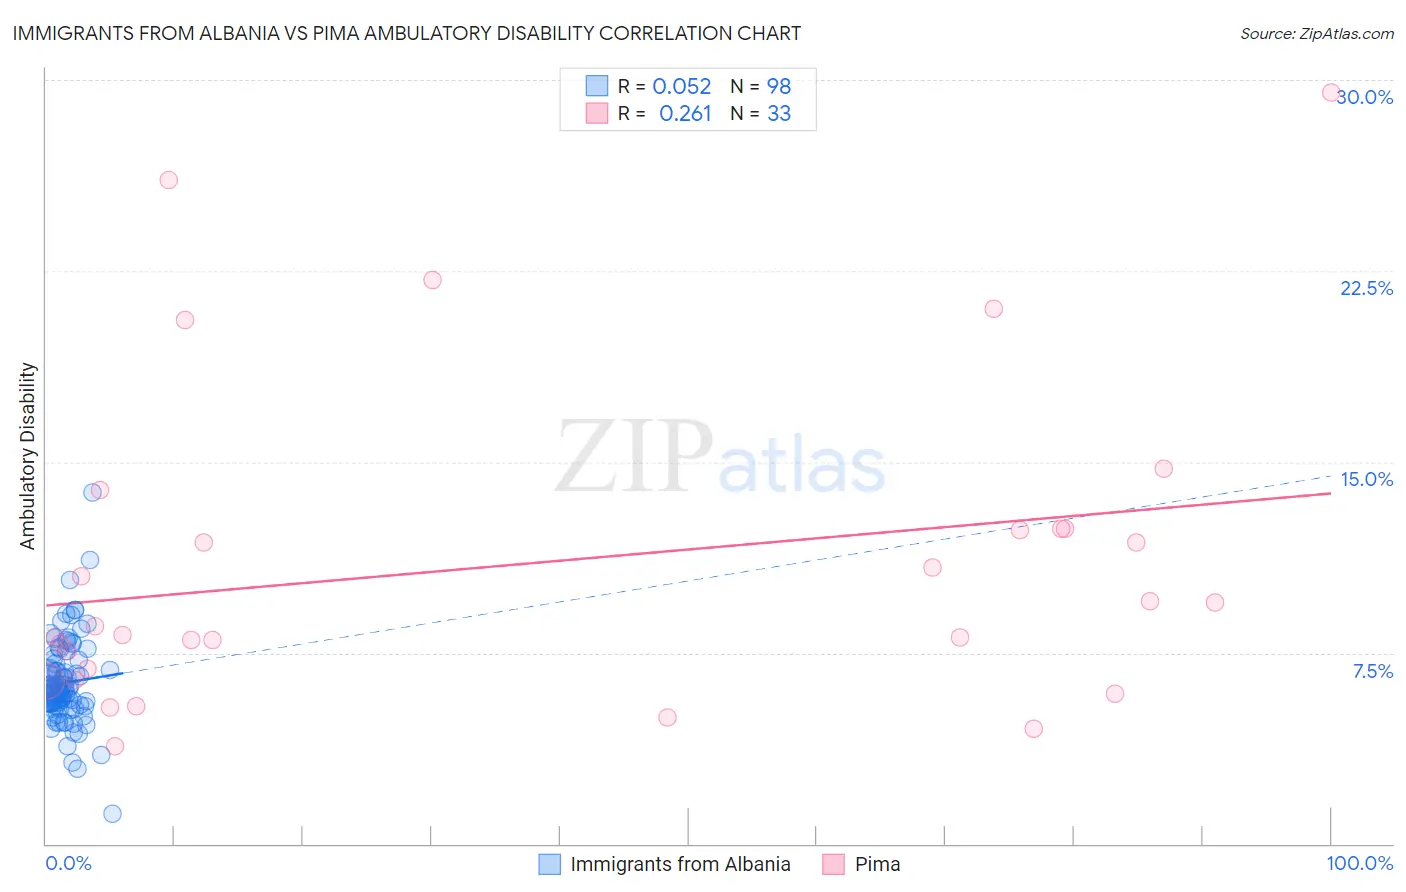
Immigrants from Albania vs Pima Ambulatory Disability Correlation Chart
The statistical analysis conducted on geographies consisting of 119,394,227 people shows a slight positive correlation between the proportion of Immigrants from Albania and percentage of population with ambulatory disability in the United States with a correlation coefficient (R) of 0.052 and weighted average of 6.3%. Similarly, the statistical analysis conducted on geographies consisting of 61,538,415 people shows a weak positive correlation between the proportion of Pima and percentage of population with ambulatory disability in the United States with a correlation coefficient (R) of 0.261 and weighted average of 8.2%, a difference of 30.9%.
Ambulatory Disability Correlation Summary
| Measurement | Immigrants from Albania | Pima |
| Minimum | 1.2% | 3.8% |
| Maximum | 13.8% | 29.5% |
| Range | 12.6% | 25.7% |
| Mean | 6.3% | 11.0% |
| Median | 6.0% | 8.6% |
| Interquartile 25% (IQ1) | 5.5% | 6.7% |
| Interquartile 75% (IQ3) | 7.1% | 12.4% |
| Interquartile Range (IQR) | 1.6% | 5.7% |
| Standard Deviation (Sample) | 1.7% | 6.3% |
| Standard Deviation (Population) | 1.7% | 6.2% |
Similar Demographics by Ambulatory Disability
Demographics Similar to Immigrants from Albania by Ambulatory Disability
In terms of ambulatory disability, the demographic groups most similar to Immigrants from Albania are Hungarian (6.3%, a difference of 0.010%), German Russian (6.3%, a difference of 0.030%), Indonesian (6.3%, a difference of 0.040%), Guamanian/Chamorro (6.3%, a difference of 0.13%), and Canadian (6.3%, a difference of 0.18%).
| Demographics | Rating | Rank | Ambulatory Disability |
| Japanese | 12.0 /100 | #213 | Poor 6.3% |
| Immigrants | Mexico | 11.0 /100 | #214 | Poor 6.3% |
| Immigrants | Latin America | 11.0 /100 | #215 | Poor 6.3% |
| Canadians | 10.9 /100 | #216 | Poor 6.3% |
| Yugoslavians | 10.9 /100 | #217 | Poor 6.3% |
| Guamanians/Chamorros | 10.6 /100 | #218 | Poor 6.3% |
| Indonesians | 9.9 /100 | #219 | Tragic 6.3% |
| Immigrants | Albania | 9.6 /100 | #220 | Tragic 6.3% |
| Hungarians | 9.6 /100 | #221 | Tragic 6.3% |
| German Russians | 9.4 /100 | #222 | Tragic 6.3% |
| Immigrants | Honduras | 7.6 /100 | #223 | Tragic 6.3% |
| Liberians | 7.1 /100 | #224 | Tragic 6.3% |
| Hondurans | 6.3 /100 | #225 | Tragic 6.3% |
| Slavs | 5.1 /100 | #226 | Tragic 6.4% |
| Cubans | 4.0 /100 | #227 | Tragic 6.4% |
Demographics Similar to Pima by Ambulatory Disability
In terms of ambulatory disability, the demographic groups most similar to Pima are Colville (8.2%, a difference of 0.35%), Choctaw (8.3%, a difference of 0.83%), Dutch West Indian (8.2%, a difference of 0.92%), Creek (8.5%, a difference of 2.5%), and Seminole (8.0%, a difference of 2.6%).
| Demographics | Rating | Rank | Ambulatory Disability |
| Menominee | 0.0 /100 | #332 | Tragic 7.8% |
| Cherokee | 0.0 /100 | #333 | Tragic 7.9% |
| Yuman | 0.0 /100 | #334 | Tragic 7.9% |
| Chickasaw | 0.0 /100 | #335 | Tragic 8.0% |
| Seminole | 0.0 /100 | #336 | Tragic 8.0% |
| Dutch West Indians | 0.0 /100 | #337 | Tragic 8.2% |
| Colville | 0.0 /100 | #338 | Tragic 8.2% |
| Pima | 0.0 /100 | #339 | Tragic 8.2% |
| Choctaw | 0.0 /100 | #340 | Tragic 8.3% |
| Creek | 0.0 /100 | #341 | Tragic 8.5% |
| Kiowa | 0.0 /100 | #342 | Tragic 8.6% |
| Tohono O'odham | 0.0 /100 | #343 | Tragic 8.7% |
| Tsimshian | 0.0 /100 | #344 | Tragic 8.8% |
| Puerto Ricans | 0.0 /100 | #345 | Tragic 8.9% |
| Houma | 0.0 /100 | #346 | Tragic 9.3% |