Scotch-Irish vs Immigrants from Spain Ambulatory Disability
COMPARE
Scotch-Irish
Immigrants from Spain
Ambulatory Disability
Ambulatory Disability Comparison
Scotch-Irish
Immigrants from Spain
6.9%
AMBULATORY DISABILITY
0.0/ 100
METRIC RATING
290th/ 347
METRIC RANK
5.6%
AMBULATORY DISABILITY
99.7/ 100
METRIC RATING
62nd/ 347
METRIC RANK
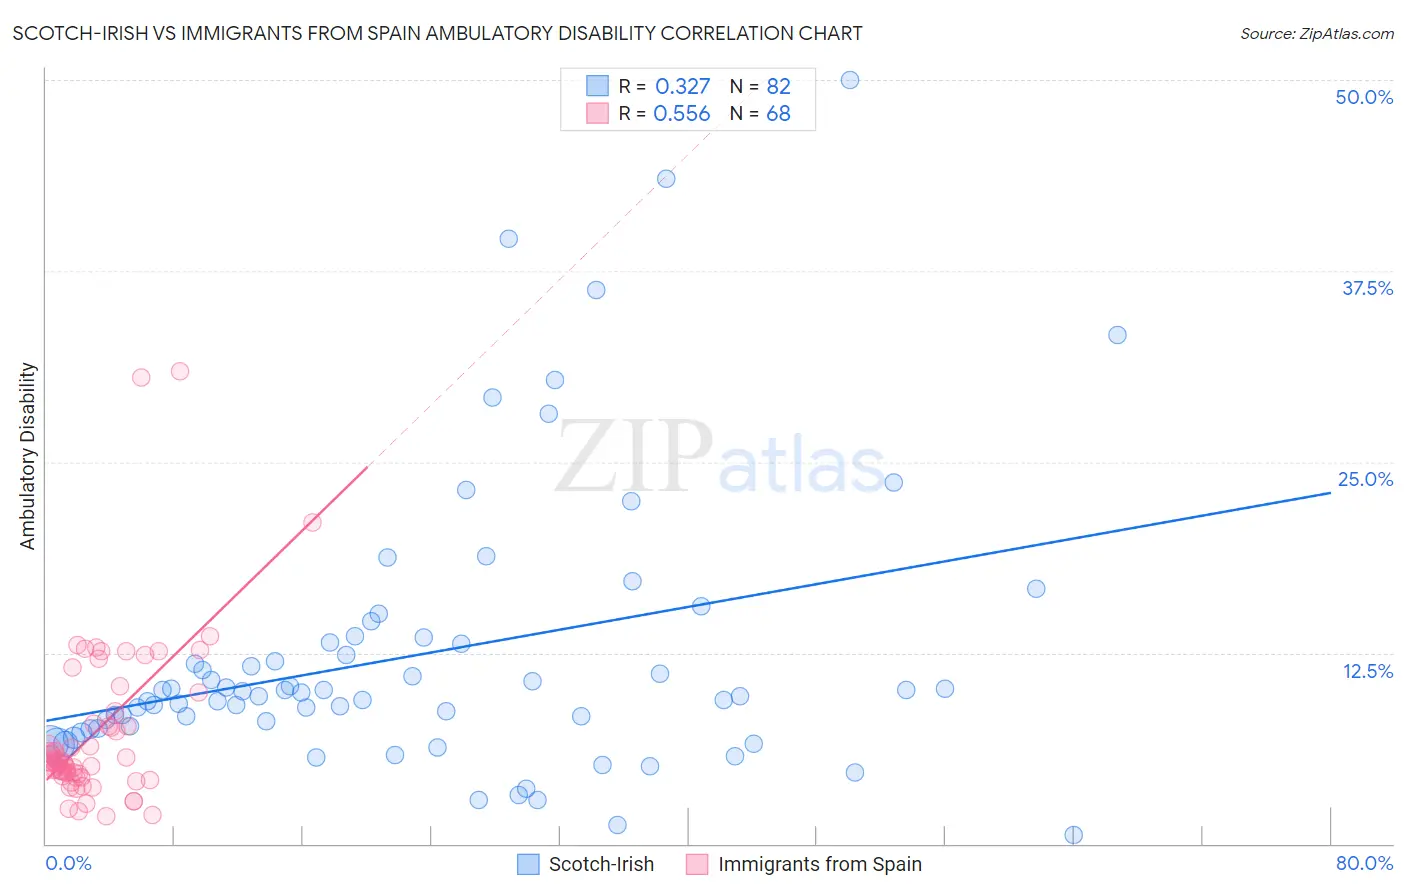
Scotch-Irish vs Immigrants from Spain Ambulatory Disability Correlation Chart
The statistical analysis conducted on geographies consisting of 548,439,452 people shows a mild positive correlation between the proportion of Scotch-Irish and percentage of population with ambulatory disability in the United States with a correlation coefficient (R) of 0.327 and weighted average of 6.9%. Similarly, the statistical analysis conducted on geographies consisting of 239,653,426 people shows a substantial positive correlation between the proportion of Immigrants from Spain and percentage of population with ambulatory disability in the United States with a correlation coefficient (R) of 0.556 and weighted average of 5.6%, a difference of 21.7%.
Ambulatory Disability Correlation Summary
| Measurement | Scotch-Irish | Immigrants from Spain |
| Minimum | 0.57% | 1.8% |
| Maximum | 50.0% | 31.0% |
| Range | 49.4% | 29.2% |
| Mean | 12.4% | 7.3% |
| Median | 9.8% | 5.4% |
| Interquartile 25% (IQ1) | 7.5% | 4.5% |
| Interquartile 75% (IQ3) | 13.2% | 8.3% |
| Interquartile Range (IQR) | 5.6% | 3.8% |
| Standard Deviation (Sample) | 9.3% | 5.5% |
| Standard Deviation (Population) | 9.2% | 5.5% |
Similar Demographics by Ambulatory Disability
Demographics Similar to Scotch-Irish by Ambulatory Disability
In terms of ambulatory disability, the demographic groups most similar to Scotch-Irish are Immigrants from Dominica (6.9%, a difference of 0.030%), West Indian (6.9%, a difference of 0.10%), Cheyenne (6.9%, a difference of 0.16%), Nonimmigrants (6.9%, a difference of 0.17%), and Immigrants from St. Vincent and the Grenadines (6.9%, a difference of 0.40%).
| Demographics | Rating | Rank | Ambulatory Disability |
| Immigrants | Barbados | 0.0 /100 | #283 | Tragic 6.8% |
| Immigrants | Jamaica | 0.0 /100 | #284 | Tragic 6.8% |
| Fijians | 0.0 /100 | #285 | Tragic 6.8% |
| Yakama | 0.0 /100 | #286 | Tragic 6.8% |
| U.S. Virgin Islanders | 0.0 /100 | #287 | Tragic 6.8% |
| Immigrants | Nonimmigrants | 0.0 /100 | #288 | Tragic 6.9% |
| Immigrants | Dominica | 0.0 /100 | #289 | Tragic 6.9% |
| Scotch-Irish | 0.0 /100 | #290 | Tragic 6.9% |
| West Indians | 0.0 /100 | #291 | Tragic 6.9% |
| Cheyenne | 0.0 /100 | #292 | Tragic 6.9% |
| Immigrants | St. Vincent and the Grenadines | 0.0 /100 | #293 | Tragic 6.9% |
| Cape Verdeans | 0.0 /100 | #294 | Tragic 6.9% |
| Crow | 0.0 /100 | #295 | Tragic 6.9% |
| Alaskan Athabascans | 0.0 /100 | #296 | Tragic 6.9% |
| French American Indians | 0.0 /100 | #297 | Tragic 6.9% |
Demographics Similar to Immigrants from Spain by Ambulatory Disability
In terms of ambulatory disability, the demographic groups most similar to Immigrants from Spain are Immigrants from Belgium (5.6%, a difference of 0.010%), Immigrants from France (5.6%, a difference of 0.12%), Immigrants from Lithuania (5.6%, a difference of 0.13%), Immigrants from Afghanistan (5.6%, a difference of 0.17%), and Immigrants from Zimbabwe (5.6%, a difference of 0.21%).
| Demographics | Rating | Rank | Ambulatory Disability |
| Immigrants | Bulgaria | 99.8 /100 | #55 | Exceptional 5.6% |
| Inupiat | 99.8 /100 | #56 | Exceptional 5.6% |
| Immigrants | Brazil | 99.8 /100 | #57 | Exceptional 5.6% |
| Immigrants | Zimbabwe | 99.8 /100 | #58 | Exceptional 5.6% |
| Immigrants | Afghanistan | 99.8 /100 | #59 | Exceptional 5.6% |
| Immigrants | Lithuania | 99.8 /100 | #60 | Exceptional 5.6% |
| Immigrants | Belgium | 99.7 /100 | #61 | Exceptional 5.6% |
| Immigrants | Spain | 99.7 /100 | #62 | Exceptional 5.6% |
| Immigrants | France | 99.7 /100 | #63 | Exceptional 5.6% |
| Laotians | 99.7 /100 | #64 | Exceptional 5.7% |
| Immigrants | Switzerland | 99.7 /100 | #65 | Exceptional 5.7% |
| Israelis | 99.6 /100 | #66 | Exceptional 5.7% |
| Immigrants | Uganda | 99.6 /100 | #67 | Exceptional 5.7% |
| Sri Lankans | 99.6 /100 | #68 | Exceptional 5.7% |
| Peruvians | 99.5 /100 | #69 | Exceptional 5.7% |