Bolivian vs Immigrants from Spain Ambulatory Disability
COMPARE
Bolivian
Immigrants from Spain
Ambulatory Disability
Ambulatory Disability Comparison
Bolivians
Immigrants from Spain
5.1%
AMBULATORY DISABILITY
100.0/ 100
METRIC RATING
7th/ 347
METRIC RANK
5.6%
AMBULATORY DISABILITY
99.7/ 100
METRIC RATING
62nd/ 347
METRIC RANK
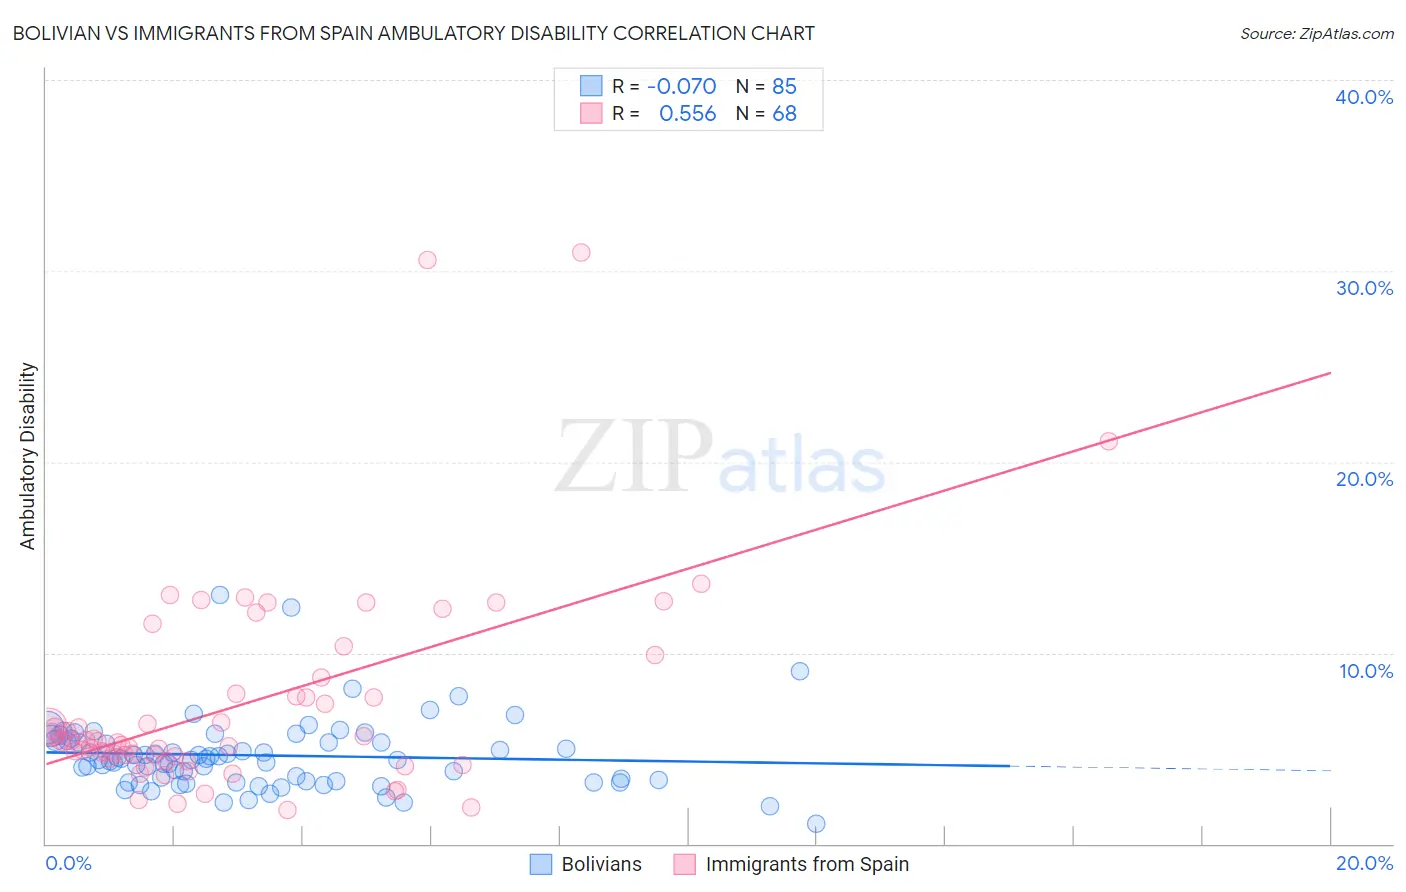
Bolivian vs Immigrants from Spain Ambulatory Disability Correlation Chart
The statistical analysis conducted on geographies consisting of 184,650,218 people shows a slight negative correlation between the proportion of Bolivians and percentage of population with ambulatory disability in the United States with a correlation coefficient (R) of -0.070 and weighted average of 5.1%. Similarly, the statistical analysis conducted on geographies consisting of 239,653,426 people shows a substantial positive correlation between the proportion of Immigrants from Spain and percentage of population with ambulatory disability in the United States with a correlation coefficient (R) of 0.556 and weighted average of 5.6%, a difference of 11.5%.
Ambulatory Disability Correlation Summary
| Measurement | Bolivian | Immigrants from Spain |
| Minimum | 1.0% | 1.8% |
| Maximum | 13.1% | 31.0% |
| Range | 12.0% | 29.2% |
| Mean | 4.6% | 7.3% |
| Median | 4.4% | 5.4% |
| Interquartile 25% (IQ1) | 3.3% | 4.5% |
| Interquartile 75% (IQ3) | 5.4% | 8.3% |
| Interquartile Range (IQR) | 2.1% | 3.8% |
| Standard Deviation (Sample) | 1.9% | 5.5% |
| Standard Deviation (Population) | 1.9% | 5.5% |
Similar Demographics by Ambulatory Disability
Demographics Similar to Bolivians by Ambulatory Disability
In terms of ambulatory disability, the demographic groups most similar to Bolivians are Immigrants from Bolivia (5.0%, a difference of 0.38%), Immigrants from South Central Asia (5.1%, a difference of 0.99%), Immigrants from Singapore (5.0%, a difference of 1.1%), Iranian (5.1%, a difference of 1.4%), and Yup'ik (5.2%, a difference of 2.0%).
| Demographics | Rating | Rank | Ambulatory Disability |
| Immigrants | India | 100.0 /100 | #1 | Exceptional 4.8% |
| Filipinos | 100.0 /100 | #2 | Exceptional 4.9% |
| Thais | 100.0 /100 | #3 | Exceptional 4.9% |
| Immigrants | Taiwan | 100.0 /100 | #4 | Exceptional 4.9% |
| Immigrants | Singapore | 100.0 /100 | #5 | Exceptional 5.0% |
| Immigrants | Bolivia | 100.0 /100 | #6 | Exceptional 5.0% |
| Bolivians | 100.0 /100 | #7 | Exceptional 5.1% |
| Immigrants | South Central Asia | 100.0 /100 | #8 | Exceptional 5.1% |
| Iranians | 100.0 /100 | #9 | Exceptional 5.1% |
| Yup'ik | 100.0 /100 | #10 | Exceptional 5.2% |
| Immigrants | Korea | 100.0 /100 | #11 | Exceptional 5.2% |
| Okinawans | 100.0 /100 | #12 | Exceptional 5.3% |
| Burmese | 100.0 /100 | #13 | Exceptional 5.3% |
| Immigrants | Eastern Asia | 100.0 /100 | #14 | Exceptional 5.3% |
| Immigrants | China | 100.0 /100 | #15 | Exceptional 5.3% |
Demographics Similar to Immigrants from Spain by Ambulatory Disability
In terms of ambulatory disability, the demographic groups most similar to Immigrants from Spain are Immigrants from Belgium (5.6%, a difference of 0.010%), Immigrants from France (5.6%, a difference of 0.12%), Immigrants from Lithuania (5.6%, a difference of 0.13%), Immigrants from Afghanistan (5.6%, a difference of 0.17%), and Immigrants from Zimbabwe (5.6%, a difference of 0.21%).
| Demographics | Rating | Rank | Ambulatory Disability |
| Immigrants | Bulgaria | 99.8 /100 | #55 | Exceptional 5.6% |
| Inupiat | 99.8 /100 | #56 | Exceptional 5.6% |
| Immigrants | Brazil | 99.8 /100 | #57 | Exceptional 5.6% |
| Immigrants | Zimbabwe | 99.8 /100 | #58 | Exceptional 5.6% |
| Immigrants | Afghanistan | 99.8 /100 | #59 | Exceptional 5.6% |
| Immigrants | Lithuania | 99.8 /100 | #60 | Exceptional 5.6% |
| Immigrants | Belgium | 99.7 /100 | #61 | Exceptional 5.6% |
| Immigrants | Spain | 99.7 /100 | #62 | Exceptional 5.6% |
| Immigrants | France | 99.7 /100 | #63 | Exceptional 5.6% |
| Laotians | 99.7 /100 | #64 | Exceptional 5.7% |
| Immigrants | Switzerland | 99.7 /100 | #65 | Exceptional 5.7% |
| Israelis | 99.6 /100 | #66 | Exceptional 5.7% |
| Immigrants | Uganda | 99.6 /100 | #67 | Exceptional 5.7% |
| Sri Lankans | 99.6 /100 | #68 | Exceptional 5.7% |
| Peruvians | 99.5 /100 | #69 | Exceptional 5.7% |