Apache vs Immigrants from Spain Ambulatory Disability
COMPARE
Apache
Immigrants from Spain
Ambulatory Disability
Ambulatory Disability Comparison
Apache
Immigrants from Spain
7.4%
AMBULATORY DISABILITY
0.0/ 100
METRIC RATING
321st/ 347
METRIC RANK
5.6%
AMBULATORY DISABILITY
99.7/ 100
METRIC RATING
62nd/ 347
METRIC RANK
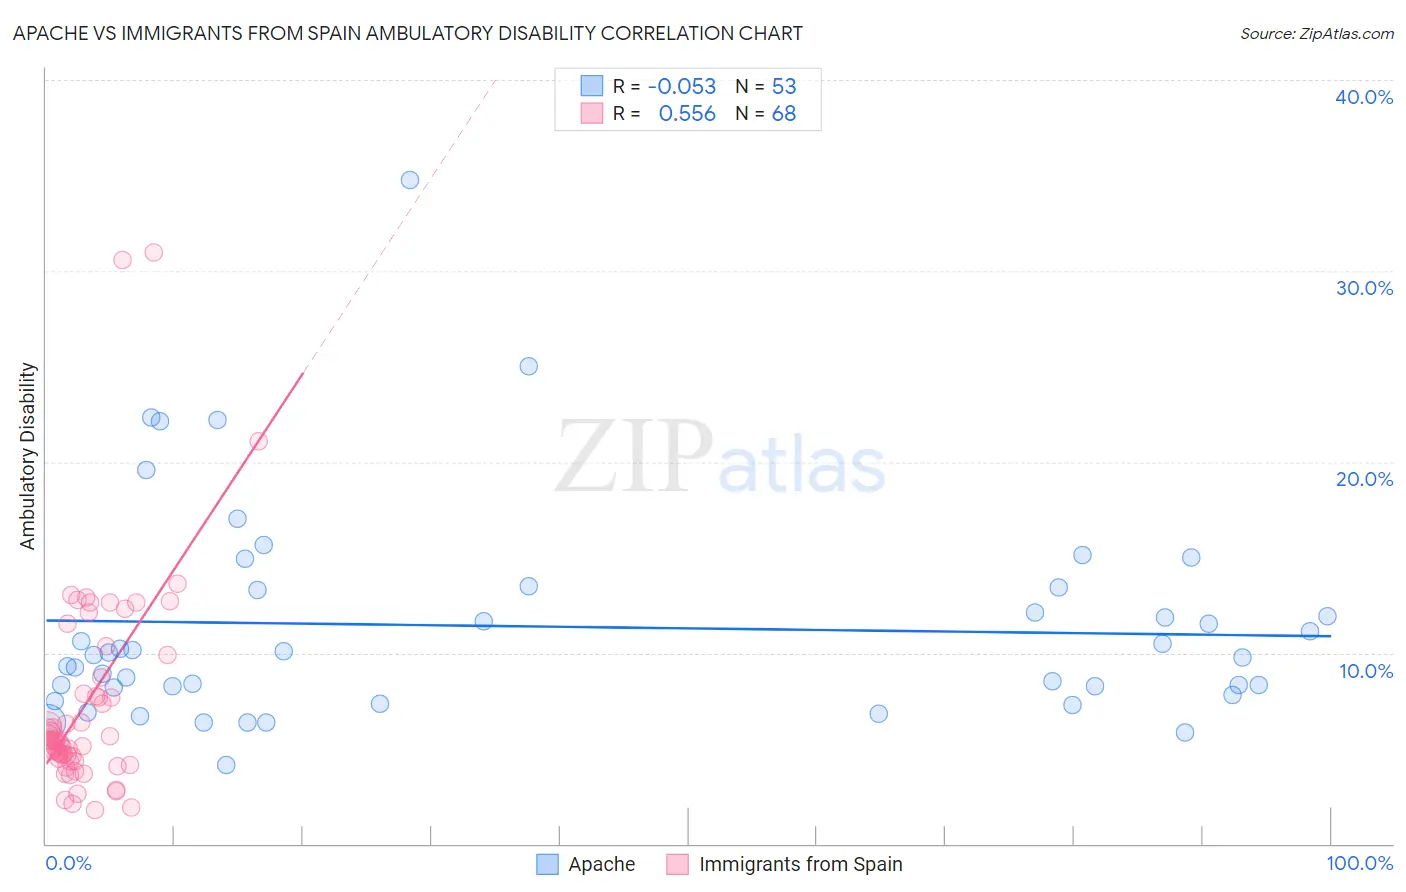
Apache vs Immigrants from Spain Ambulatory Disability Correlation Chart
The statistical analysis conducted on geographies consisting of 231,047,475 people shows a slight negative correlation between the proportion of Apache and percentage of population with ambulatory disability in the United States with a correlation coefficient (R) of -0.053 and weighted average of 7.4%. Similarly, the statistical analysis conducted on geographies consisting of 239,653,426 people shows a substantial positive correlation between the proportion of Immigrants from Spain and percentage of population with ambulatory disability in the United States with a correlation coefficient (R) of 0.556 and weighted average of 5.6%, a difference of 30.8%.
Ambulatory Disability Correlation Summary
| Measurement | Apache | Immigrants from Spain |
| Minimum | 4.1% | 1.8% |
| Maximum | 34.8% | 31.0% |
| Range | 30.7% | 29.2% |
| Mean | 11.4% | 7.3% |
| Median | 9.9% | 5.4% |
| Interquartile 25% (IQ1) | 8.0% | 4.5% |
| Interquartile 75% (IQ3) | 13.4% | 8.3% |
| Interquartile Range (IQR) | 5.4% | 3.8% |
| Standard Deviation (Sample) | 5.7% | 5.5% |
| Standard Deviation (Population) | 5.6% | 5.5% |
Similar Demographics by Ambulatory Disability
Demographics Similar to Apache by Ambulatory Disability
In terms of ambulatory disability, the demographic groups most similar to Apache are Osage (7.4%, a difference of 0.14%), American (7.4%, a difference of 0.42%), Potawatomi (7.3%, a difference of 0.81%), Navajo (7.5%, a difference of 1.7%), and Comanche (7.5%, a difference of 1.8%).
| Demographics | Rating | Rank | Ambulatory Disability |
| Blackfeet | 0.0 /100 | #314 | Tragic 7.1% |
| Shoshone | 0.0 /100 | #315 | Tragic 7.1% |
| Immigrants | Dominican Republic | 0.0 /100 | #316 | Tragic 7.1% |
| Central American Indians | 0.0 /100 | #317 | Tragic 7.2% |
| Ottawa | 0.0 /100 | #318 | Tragic 7.2% |
| Dominicans | 0.0 /100 | #319 | Tragic 7.2% |
| Potawatomi | 0.0 /100 | #320 | Tragic 7.3% |
| Apache | 0.0 /100 | #321 | Tragic 7.4% |
| Osage | 0.0 /100 | #322 | Tragic 7.4% |
| Americans | 0.0 /100 | #323 | Tragic 7.4% |
| Navajo | 0.0 /100 | #324 | Tragic 7.5% |
| Comanche | 0.0 /100 | #325 | Tragic 7.5% |
| Blacks/African Americans | 0.0 /100 | #326 | Tragic 7.5% |
| Natives/Alaskans | 0.0 /100 | #327 | Tragic 7.5% |
| Hopi | 0.0 /100 | #328 | Tragic 7.6% |
Demographics Similar to Immigrants from Spain by Ambulatory Disability
In terms of ambulatory disability, the demographic groups most similar to Immigrants from Spain are Immigrants from Belgium (5.6%, a difference of 0.010%), Immigrants from France (5.6%, a difference of 0.12%), Immigrants from Lithuania (5.6%, a difference of 0.13%), Immigrants from Afghanistan (5.6%, a difference of 0.17%), and Immigrants from Zimbabwe (5.6%, a difference of 0.21%).
| Demographics | Rating | Rank | Ambulatory Disability |
| Immigrants | Bulgaria | 99.8 /100 | #55 | Exceptional 5.6% |
| Inupiat | 99.8 /100 | #56 | Exceptional 5.6% |
| Immigrants | Brazil | 99.8 /100 | #57 | Exceptional 5.6% |
| Immigrants | Zimbabwe | 99.8 /100 | #58 | Exceptional 5.6% |
| Immigrants | Afghanistan | 99.8 /100 | #59 | Exceptional 5.6% |
| Immigrants | Lithuania | 99.8 /100 | #60 | Exceptional 5.6% |
| Immigrants | Belgium | 99.7 /100 | #61 | Exceptional 5.6% |
| Immigrants | Spain | 99.7 /100 | #62 | Exceptional 5.6% |
| Immigrants | France | 99.7 /100 | #63 | Exceptional 5.6% |
| Laotians | 99.7 /100 | #64 | Exceptional 5.7% |
| Immigrants | Switzerland | 99.7 /100 | #65 | Exceptional 5.7% |
| Israelis | 99.6 /100 | #66 | Exceptional 5.7% |
| Immigrants | Uganda | 99.6 /100 | #67 | Exceptional 5.7% |
| Sri Lankans | 99.6 /100 | #68 | Exceptional 5.7% |
| Peruvians | 99.5 /100 | #69 | Exceptional 5.7% |