Chinese vs Immigrants from Spain Ambulatory Disability
COMPARE
Chinese
Immigrants from Spain
Ambulatory Disability
Ambulatory Disability Comparison
Chinese
Immigrants from Spain
6.5%
AMBULATORY DISABILITY
1.0/ 100
METRIC RATING
250th/ 347
METRIC RANK
5.6%
AMBULATORY DISABILITY
99.7/ 100
METRIC RATING
62nd/ 347
METRIC RANK
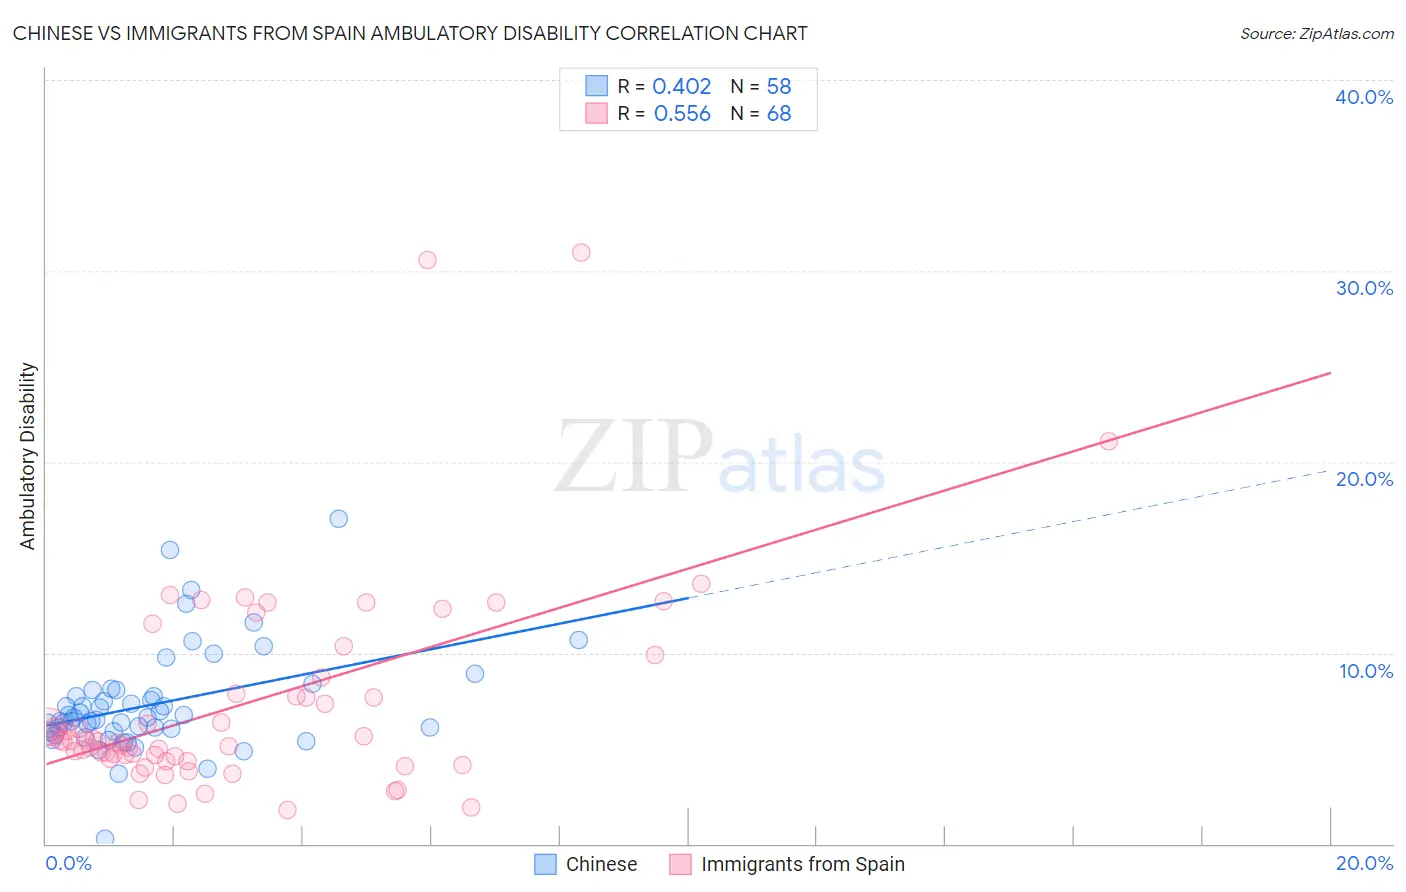
Chinese vs Immigrants from Spain Ambulatory Disability Correlation Chart
The statistical analysis conducted on geographies consisting of 64,795,509 people shows a moderate positive correlation between the proportion of Chinese and percentage of population with ambulatory disability in the United States with a correlation coefficient (R) of 0.402 and weighted average of 6.5%. Similarly, the statistical analysis conducted on geographies consisting of 239,653,426 people shows a substantial positive correlation between the proportion of Immigrants from Spain and percentage of population with ambulatory disability in the United States with a correlation coefficient (R) of 0.556 and weighted average of 5.6%, a difference of 15.0%.
Ambulatory Disability Correlation Summary
| Measurement | Chinese | Immigrants from Spain |
| Minimum | 0.26% | 1.8% |
| Maximum | 17.0% | 31.0% |
| Range | 16.8% | 29.2% |
| Mean | 7.3% | 7.3% |
| Median | 6.6% | 5.4% |
| Interquartile 25% (IQ1) | 5.9% | 4.5% |
| Interquartile 75% (IQ3) | 8.1% | 8.3% |
| Interquartile Range (IQR) | 2.2% | 3.8% |
| Standard Deviation (Sample) | 2.7% | 5.5% |
| Standard Deviation (Population) | 2.7% | 5.5% |
Similar Demographics by Ambulatory Disability
Demographics Similar to Chinese by Ambulatory Disability
In terms of ambulatory disability, the demographic groups most similar to Chinese are Native Hawaiian (6.5%, a difference of 0.080%), Hawaiian (6.5%, a difference of 0.18%), Immigrants from Portugal (6.5%, a difference of 0.36%), Immigrants from Cuba (6.5%, a difference of 0.38%), and Immigrants from Bahamas (6.5%, a difference of 0.38%).
| Demographics | Rating | Rank | Ambulatory Disability |
| Germans | 1.5 /100 | #243 | Tragic 6.5% |
| Immigrants | Panama | 1.5 /100 | #244 | Tragic 6.5% |
| Tlingit-Haida | 1.5 /100 | #245 | Tragic 6.5% |
| Armenians | 1.5 /100 | #246 | Tragic 6.5% |
| Immigrants | Cuba | 1.4 /100 | #247 | Tragic 6.5% |
| Immigrants | Portugal | 1.4 /100 | #248 | Tragic 6.5% |
| Native Hawaiians | 1.1 /100 | #249 | Tragic 6.5% |
| Chinese | 1.0 /100 | #250 | Tragic 6.5% |
| Hawaiians | 0.9 /100 | #251 | Tragic 6.5% |
| Immigrants | Bahamas | 0.8 /100 | #252 | Tragic 6.5% |
| Scottish | 0.7 /100 | #253 | Tragic 6.5% |
| Belizeans | 0.7 /100 | #254 | Tragic 6.5% |
| Welsh | 0.6 /100 | #255 | Tragic 6.5% |
| Immigrants | Uzbekistan | 0.6 /100 | #256 | Tragic 6.5% |
| Bermudans | 0.5 /100 | #257 | Tragic 6.5% |
Demographics Similar to Immigrants from Spain by Ambulatory Disability
In terms of ambulatory disability, the demographic groups most similar to Immigrants from Spain are Immigrants from Belgium (5.6%, a difference of 0.010%), Immigrants from France (5.6%, a difference of 0.12%), Immigrants from Lithuania (5.6%, a difference of 0.13%), Immigrants from Afghanistan (5.6%, a difference of 0.17%), and Immigrants from Zimbabwe (5.6%, a difference of 0.21%).
| Demographics | Rating | Rank | Ambulatory Disability |
| Immigrants | Bulgaria | 99.8 /100 | #55 | Exceptional 5.6% |
| Inupiat | 99.8 /100 | #56 | Exceptional 5.6% |
| Immigrants | Brazil | 99.8 /100 | #57 | Exceptional 5.6% |
| Immigrants | Zimbabwe | 99.8 /100 | #58 | Exceptional 5.6% |
| Immigrants | Afghanistan | 99.8 /100 | #59 | Exceptional 5.6% |
| Immigrants | Lithuania | 99.8 /100 | #60 | Exceptional 5.6% |
| Immigrants | Belgium | 99.7 /100 | #61 | Exceptional 5.6% |
| Immigrants | Spain | 99.7 /100 | #62 | Exceptional 5.6% |
| Immigrants | France | 99.7 /100 | #63 | Exceptional 5.6% |
| Laotians | 99.7 /100 | #64 | Exceptional 5.7% |
| Immigrants | Switzerland | 99.7 /100 | #65 | Exceptional 5.7% |
| Israelis | 99.6 /100 | #66 | Exceptional 5.7% |
| Immigrants | Uganda | 99.6 /100 | #67 | Exceptional 5.7% |
| Sri Lankans | 99.6 /100 | #68 | Exceptional 5.7% |
| Peruvians | 99.5 /100 | #69 | Exceptional 5.7% |