Immigrants from Western Asia vs Immigrants from Spain Ambulatory Disability
COMPARE
Immigrants from Western Asia
Immigrants from Spain
Ambulatory Disability
Ambulatory Disability Comparison
Immigrants from Western Asia
Immigrants from Spain
5.9%
AMBULATORY DISABILITY
90.7/ 100
METRIC RATING
128th/ 347
METRIC RANK
5.6%
AMBULATORY DISABILITY
99.7/ 100
METRIC RATING
62nd/ 347
METRIC RANK
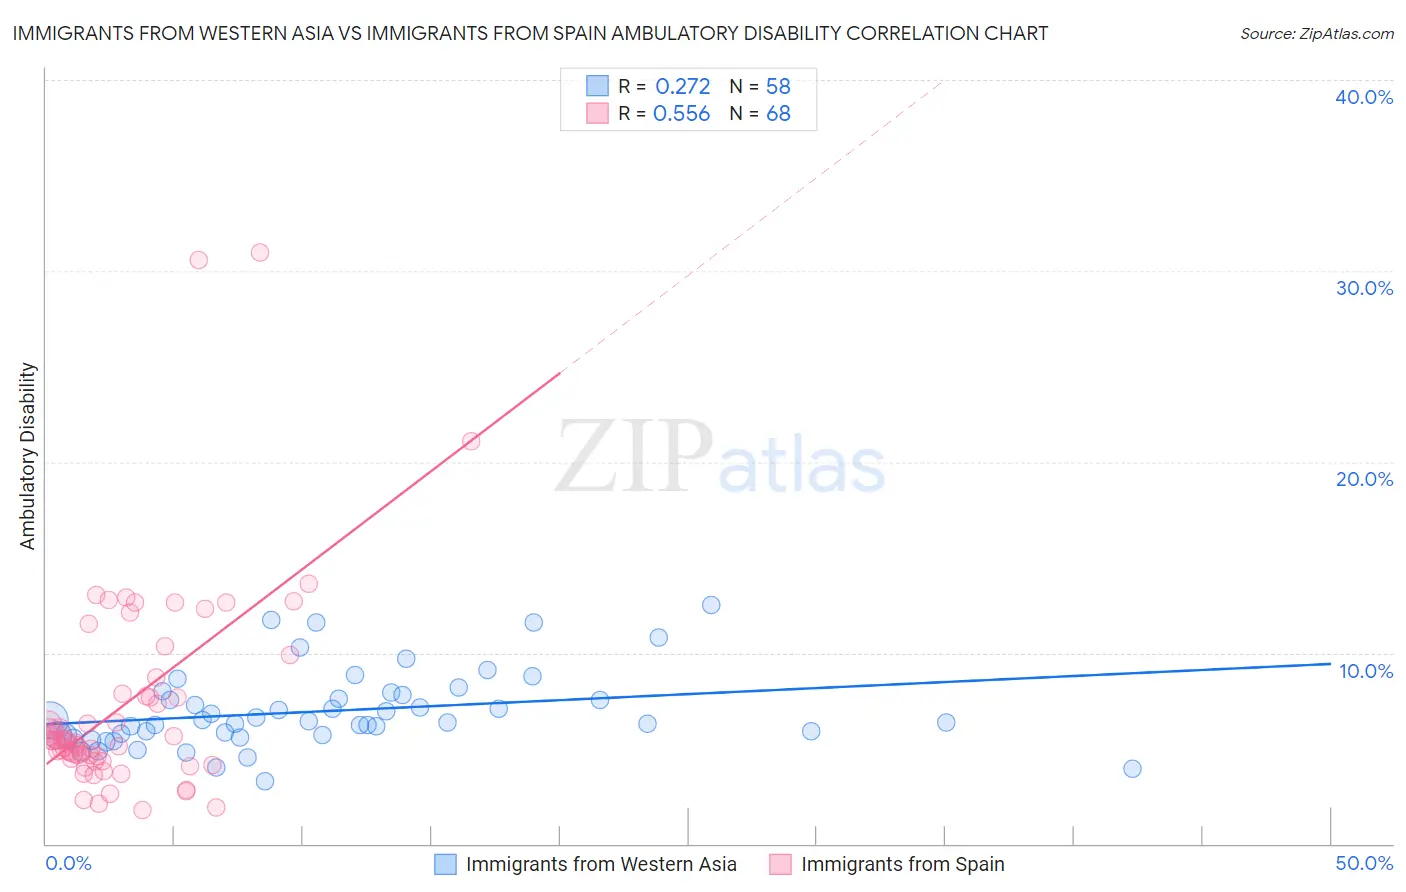
Immigrants from Western Asia vs Immigrants from Spain Ambulatory Disability Correlation Chart
The statistical analysis conducted on geographies consisting of 404,333,266 people shows a weak positive correlation between the proportion of Immigrants from Western Asia and percentage of population with ambulatory disability in the United States with a correlation coefficient (R) of 0.272 and weighted average of 5.9%. Similarly, the statistical analysis conducted on geographies consisting of 239,653,426 people shows a substantial positive correlation between the proportion of Immigrants from Spain and percentage of population with ambulatory disability in the United States with a correlation coefficient (R) of 0.556 and weighted average of 5.6%, a difference of 5.2%.
Ambulatory Disability Correlation Summary
| Measurement | Immigrants from Western Asia | Immigrants from Spain |
| Minimum | 3.3% | 1.8% |
| Maximum | 12.5% | 31.0% |
| Range | 9.3% | 29.2% |
| Mean | 6.9% | 7.3% |
| Median | 6.4% | 5.4% |
| Interquartile 25% (IQ1) | 5.7% | 4.5% |
| Interquartile 75% (IQ3) | 7.8% | 8.3% |
| Interquartile Range (IQR) | 2.1% | 3.8% |
| Standard Deviation (Sample) | 2.0% | 5.5% |
| Standard Deviation (Population) | 2.0% | 5.5% |
Similar Demographics by Ambulatory Disability
Demographics Similar to Immigrants from Western Asia by Ambulatory Disability
In terms of ambulatory disability, the demographic groups most similar to Immigrants from Western Asia are Immigrants from Norway (5.9%, a difference of 0.030%), Immigrants from Nigeria (5.9%, a difference of 0.040%), Arab (5.9%, a difference of 0.13%), Immigrants from Kazakhstan (5.9%, a difference of 0.14%), and Korean (5.9%, a difference of 0.15%).
| Demographics | Rating | Rank | Ambulatory Disability |
| Costa Ricans | 92.6 /100 | #121 | Exceptional 5.9% |
| Icelanders | 92.6 /100 | #122 | Exceptional 5.9% |
| Immigrants | Russia | 92.4 /100 | #123 | Exceptional 5.9% |
| Immigrants | Middle Africa | 92.2 /100 | #124 | Exceptional 5.9% |
| Koreans | 91.6 /100 | #125 | Exceptional 5.9% |
| Arabs | 91.5 /100 | #126 | Exceptional 5.9% |
| Immigrants | Nigeria | 90.9 /100 | #127 | Exceptional 5.9% |
| Immigrants | Western Asia | 90.7 /100 | #128 | Exceptional 5.9% |
| Immigrants | Norway | 90.5 /100 | #129 | Exceptional 5.9% |
| Immigrants | Kazakhstan | 89.7 /100 | #130 | Excellent 5.9% |
| Immigrants | Costa Rica | 89.5 /100 | #131 | Excellent 5.9% |
| Immigrants | Europe | 87.8 /100 | #132 | Excellent 6.0% |
| Immigrants | Immigrants | 86.9 /100 | #133 | Excellent 6.0% |
| Ute | 86.6 /100 | #134 | Excellent 6.0% |
| Immigrants | Italy | 85.0 /100 | #135 | Excellent 6.0% |
Demographics Similar to Immigrants from Spain by Ambulatory Disability
In terms of ambulatory disability, the demographic groups most similar to Immigrants from Spain are Immigrants from Belgium (5.6%, a difference of 0.010%), Immigrants from France (5.6%, a difference of 0.12%), Immigrants from Lithuania (5.6%, a difference of 0.13%), Immigrants from Afghanistan (5.6%, a difference of 0.17%), and Immigrants from Zimbabwe (5.6%, a difference of 0.21%).
| Demographics | Rating | Rank | Ambulatory Disability |
| Immigrants | Bulgaria | 99.8 /100 | #55 | Exceptional 5.6% |
| Inupiat | 99.8 /100 | #56 | Exceptional 5.6% |
| Immigrants | Brazil | 99.8 /100 | #57 | Exceptional 5.6% |
| Immigrants | Zimbabwe | 99.8 /100 | #58 | Exceptional 5.6% |
| Immigrants | Afghanistan | 99.8 /100 | #59 | Exceptional 5.6% |
| Immigrants | Lithuania | 99.8 /100 | #60 | Exceptional 5.6% |
| Immigrants | Belgium | 99.7 /100 | #61 | Exceptional 5.6% |
| Immigrants | Spain | 99.7 /100 | #62 | Exceptional 5.6% |
| Immigrants | France | 99.7 /100 | #63 | Exceptional 5.6% |
| Laotians | 99.7 /100 | #64 | Exceptional 5.7% |
| Immigrants | Switzerland | 99.7 /100 | #65 | Exceptional 5.7% |
| Israelis | 99.6 /100 | #66 | Exceptional 5.7% |
| Immigrants | Uganda | 99.6 /100 | #67 | Exceptional 5.7% |
| Sri Lankans | 99.6 /100 | #68 | Exceptional 5.7% |
| Peruvians | 99.5 /100 | #69 | Exceptional 5.7% |