Bulgarian vs Immigrants from Netherlands Ambulatory Disability
COMPARE
Bulgarian
Immigrants from Netherlands
Ambulatory Disability
Ambulatory Disability Comparison
Bulgarians
Immigrants from Netherlands
5.6%
AMBULATORY DISABILITY
99.9/ 100
METRIC RATING
49th/ 347
METRIC RANK
5.8%
AMBULATORY DISABILITY
97.1/ 100
METRIC RATING
109th/ 347
METRIC RANK
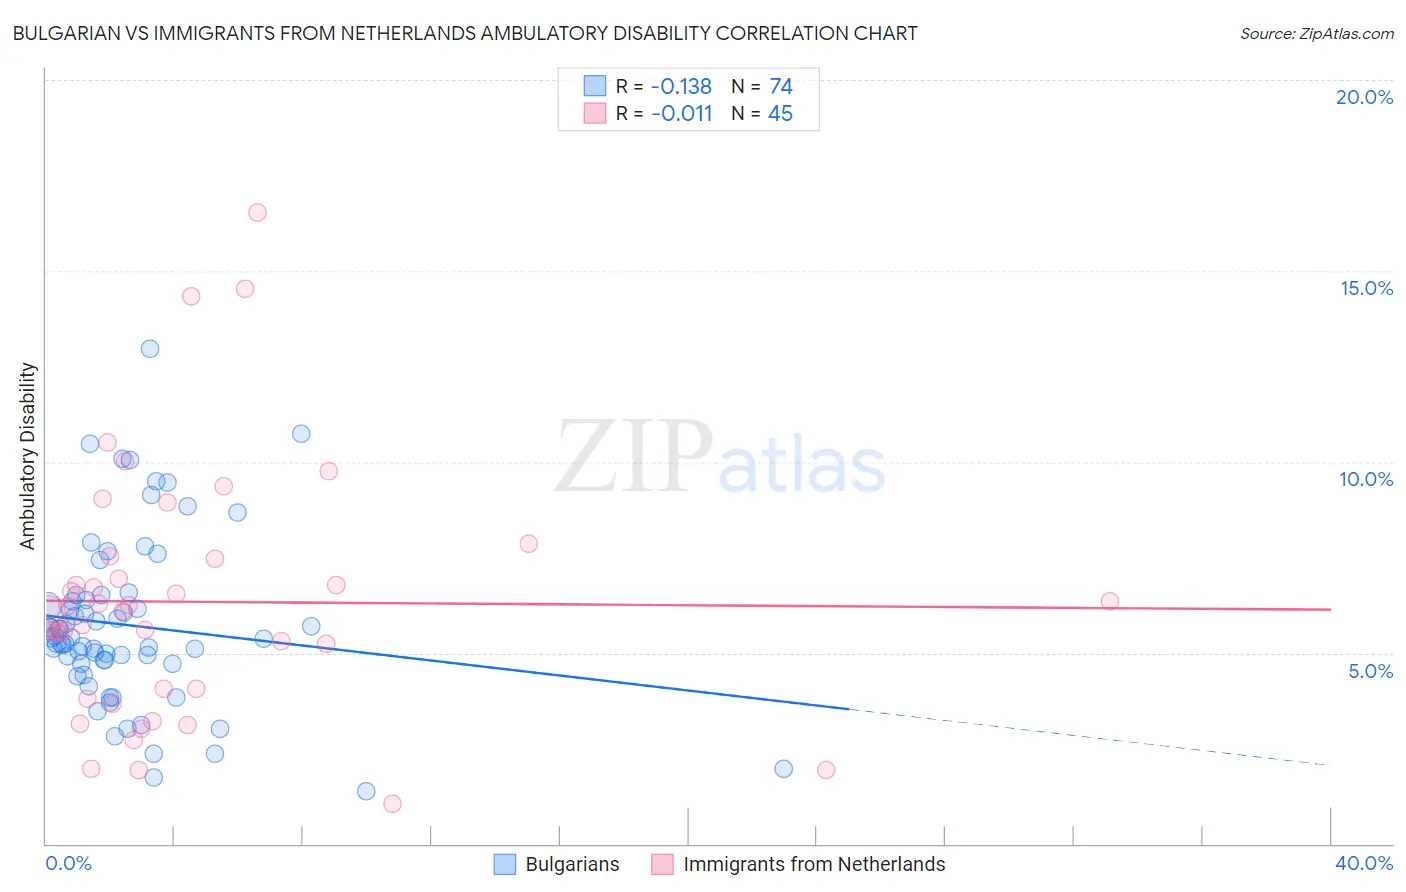
Bulgarian vs Immigrants from Netherlands Ambulatory Disability Correlation Chart
The statistical analysis conducted on geographies consisting of 205,613,194 people shows a poor negative correlation between the proportion of Bulgarians and percentage of population with ambulatory disability in the United States with a correlation coefficient (R) of -0.138 and weighted average of 5.6%. Similarly, the statistical analysis conducted on geographies consisting of 237,838,654 people shows no correlation between the proportion of Immigrants from Netherlands and percentage of population with ambulatory disability in the United States with a correlation coefficient (R) of -0.011 and weighted average of 5.8%, a difference of 4.7%.
Ambulatory Disability Correlation Summary
| Measurement | Bulgarian | Immigrants from Netherlands |
| Minimum | 1.4% | 1.1% |
| Maximum | 12.9% | 16.5% |
| Range | 11.6% | 15.5% |
| Mean | 5.7% | 6.3% |
| Median | 5.4% | 6.1% |
| Interquartile 25% (IQ1) | 4.7% | 3.9% |
| Interquartile 75% (IQ3) | 6.4% | 7.5% |
| Interquartile Range (IQR) | 1.6% | 3.6% |
| Standard Deviation (Sample) | 2.2% | 3.3% |
| Standard Deviation (Population) | 2.2% | 3.3% |
Similar Demographics by Ambulatory Disability
Demographics Similar to Bulgarians by Ambulatory Disability
In terms of ambulatory disability, the demographic groups most similar to Bulgarians are Immigrants from Argentina (5.6%, a difference of 0.19%), Egyptian (5.6%, a difference of 0.21%), Immigrants from Japan (5.6%, a difference of 0.21%), Immigrants from Sweden (5.6%, a difference of 0.22%), and Luxembourger (5.6%, a difference of 0.34%).
| Demographics | Rating | Rank | Ambulatory Disability |
| Argentineans | 99.9 /100 | #42 | Exceptional 5.5% |
| Paraguayans | 99.9 /100 | #43 | Exceptional 5.5% |
| Immigrants | Indonesia | 99.9 /100 | #44 | Exceptional 5.5% |
| Immigrants | Sweden | 99.9 /100 | #45 | Exceptional 5.6% |
| Egyptians | 99.9 /100 | #46 | Exceptional 5.6% |
| Immigrants | Japan | 99.9 /100 | #47 | Exceptional 5.6% |
| Immigrants | Argentina | 99.9 /100 | #48 | Exceptional 5.6% |
| Bulgarians | 99.9 /100 | #49 | Exceptional 5.6% |
| Luxembourgers | 99.9 /100 | #50 | Exceptional 5.6% |
| Taiwanese | 99.8 /100 | #51 | Exceptional 5.6% |
| Jordanians | 99.8 /100 | #52 | Exceptional 5.6% |
| Immigrants | Egypt | 99.8 /100 | #53 | Exceptional 5.6% |
| Immigrants | Eastern Africa | 99.8 /100 | #54 | Exceptional 5.6% |
| Immigrants | Bulgaria | 99.8 /100 | #55 | Exceptional 5.6% |
| Inupiat | 99.8 /100 | #56 | Exceptional 5.6% |
Demographics Similar to Immigrants from Netherlands by Ambulatory Disability
In terms of ambulatory disability, the demographic groups most similar to Immigrants from Netherlands are Colombian (5.8%, a difference of 0.020%), Uruguayan (5.8%, a difference of 0.030%), Immigrants from Morocco (5.8%, a difference of 0.080%), Immigrants from Czechoslovakia (5.8%, a difference of 0.15%), and Immigrants from Colombia (5.8%, a difference of 0.18%).
| Demographics | Rating | Rank | Ambulatory Disability |
| Immigrants | Kenya | 97.8 /100 | #102 | Exceptional 5.8% |
| Immigrants | Romania | 97.7 /100 | #103 | Exceptional 5.8% |
| New Zealanders | 97.6 /100 | #104 | Exceptional 5.8% |
| Immigrants | Czechoslovakia | 97.4 /100 | #105 | Exceptional 5.8% |
| Immigrants | Morocco | 97.3 /100 | #106 | Exceptional 5.8% |
| Uruguayans | 97.2 /100 | #107 | Exceptional 5.8% |
| Colombians | 97.2 /100 | #108 | Exceptional 5.8% |
| Immigrants | Netherlands | 97.1 /100 | #109 | Exceptional 5.8% |
| Immigrants | Colombia | 96.7 /100 | #110 | Exceptional 5.8% |
| Danes | 96.6 /100 | #111 | Exceptional 5.8% |
| South Africans | 96.3 /100 | #112 | Exceptional 5.9% |
| Immigrants | Uruguay | 95.6 /100 | #113 | Exceptional 5.9% |
| Immigrants | Poland | 95.4 /100 | #114 | Exceptional 5.9% |
| South American Indians | 94.8 /100 | #115 | Exceptional 5.9% |
| Immigrants | Africa | 94.7 /100 | #116 | Exceptional 5.9% |