Afghan vs Immigrants from Netherlands Ambulatory Disability
COMPARE
Afghan
Immigrants from Netherlands
Ambulatory Disability
Ambulatory Disability Comparison
Afghans
Immigrants from Netherlands
5.5%
AMBULATORY DISABILITY
100.0/ 100
METRIC RATING
35th/ 347
METRIC RANK
5.8%
AMBULATORY DISABILITY
97.1/ 100
METRIC RATING
109th/ 347
METRIC RANK
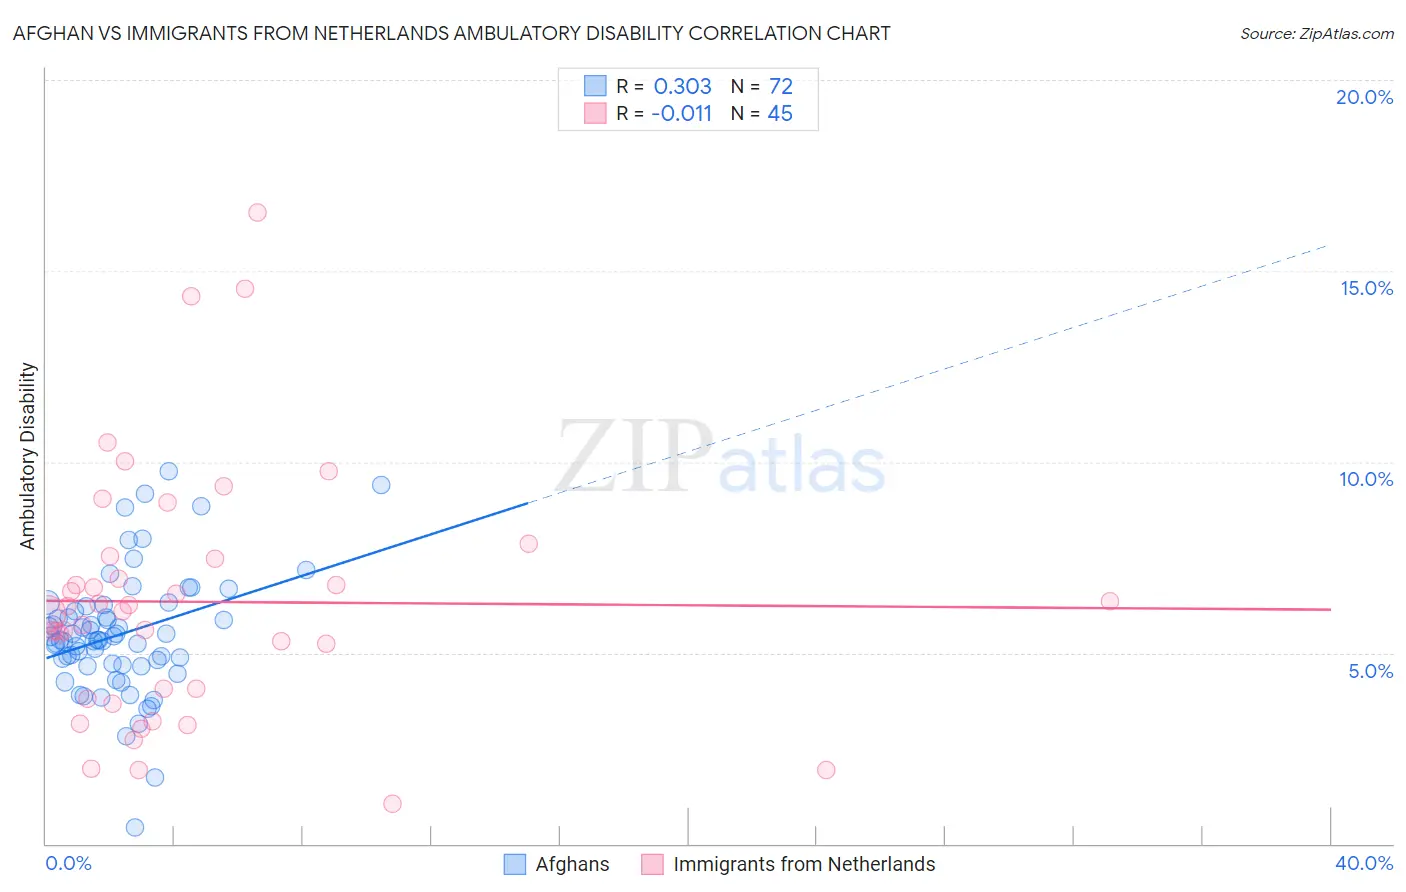
Afghan vs Immigrants from Netherlands Ambulatory Disability Correlation Chart
The statistical analysis conducted on geographies consisting of 148,854,459 people shows a mild positive correlation between the proportion of Afghans and percentage of population with ambulatory disability in the United States with a correlation coefficient (R) of 0.303 and weighted average of 5.5%. Similarly, the statistical analysis conducted on geographies consisting of 237,838,654 people shows no correlation between the proportion of Immigrants from Netherlands and percentage of population with ambulatory disability in the United States with a correlation coefficient (R) of -0.011 and weighted average of 5.8%, a difference of 6.6%.
Ambulatory Disability Correlation Summary
| Measurement | Afghan | Immigrants from Netherlands |
| Minimum | 0.43% | 1.1% |
| Maximum | 9.8% | 16.5% |
| Range | 9.3% | 15.5% |
| Mean | 5.5% | 6.3% |
| Median | 5.3% | 6.1% |
| Interquartile 25% (IQ1) | 4.7% | 3.9% |
| Interquartile 75% (IQ3) | 6.2% | 7.5% |
| Interquartile Range (IQR) | 1.5% | 3.6% |
| Standard Deviation (Sample) | 1.6% | 3.3% |
| Standard Deviation (Population) | 1.6% | 3.3% |
Similar Demographics by Ambulatory Disability
Demographics Similar to Afghans by Ambulatory Disability
In terms of ambulatory disability, the demographic groups most similar to Afghans are Immigrants from Asia (5.5%, a difference of 0.040%), Immigrants from Malaysia (5.5%, a difference of 0.070%), Turkish (5.5%, a difference of 0.080%), Cypriot (5.5%, a difference of 0.090%), and Immigrants from Eritrea (5.5%, a difference of 0.18%).
| Demographics | Rating | Rank | Ambulatory Disability |
| Cambodians | 100.0 /100 | #28 | Exceptional 5.4% |
| Immigrants | Iran | 100.0 /100 | #29 | Exceptional 5.4% |
| Immigrants | Turkey | 100.0 /100 | #30 | Exceptional 5.4% |
| Immigrants | Venezuela | 100.0 /100 | #31 | Exceptional 5.4% |
| Immigrants | Australia | 100.0 /100 | #32 | Exceptional 5.5% |
| Immigrants | Pakistan | 100.0 /100 | #33 | Exceptional 5.5% |
| Immigrants | Asia | 100.0 /100 | #34 | Exceptional 5.5% |
| Afghans | 100.0 /100 | #35 | Exceptional 5.5% |
| Immigrants | Malaysia | 100.0 /100 | #36 | Exceptional 5.5% |
| Turks | 100.0 /100 | #37 | Exceptional 5.5% |
| Cypriots | 100.0 /100 | #38 | Exceptional 5.5% |
| Immigrants | Eritrea | 100.0 /100 | #39 | Exceptional 5.5% |
| Venezuelans | 99.9 /100 | #40 | Exceptional 5.5% |
| Mongolians | 99.9 /100 | #41 | Exceptional 5.5% |
| Argentineans | 99.9 /100 | #42 | Exceptional 5.5% |
Demographics Similar to Immigrants from Netherlands by Ambulatory Disability
In terms of ambulatory disability, the demographic groups most similar to Immigrants from Netherlands are Colombian (5.8%, a difference of 0.020%), Uruguayan (5.8%, a difference of 0.030%), Immigrants from Morocco (5.8%, a difference of 0.080%), Immigrants from Czechoslovakia (5.8%, a difference of 0.15%), and Immigrants from Colombia (5.8%, a difference of 0.18%).
| Demographics | Rating | Rank | Ambulatory Disability |
| Immigrants | Kenya | 97.8 /100 | #102 | Exceptional 5.8% |
| Immigrants | Romania | 97.7 /100 | #103 | Exceptional 5.8% |
| New Zealanders | 97.6 /100 | #104 | Exceptional 5.8% |
| Immigrants | Czechoslovakia | 97.4 /100 | #105 | Exceptional 5.8% |
| Immigrants | Morocco | 97.3 /100 | #106 | Exceptional 5.8% |
| Uruguayans | 97.2 /100 | #107 | Exceptional 5.8% |
| Colombians | 97.2 /100 | #108 | Exceptional 5.8% |
| Immigrants | Netherlands | 97.1 /100 | #109 | Exceptional 5.8% |
| Immigrants | Colombia | 96.7 /100 | #110 | Exceptional 5.8% |
| Danes | 96.6 /100 | #111 | Exceptional 5.8% |
| South Africans | 96.3 /100 | #112 | Exceptional 5.9% |
| Immigrants | Uruguay | 95.6 /100 | #113 | Exceptional 5.9% |
| Immigrants | Poland | 95.4 /100 | #114 | Exceptional 5.9% |
| South American Indians | 94.8 /100 | #115 | Exceptional 5.9% |
| Immigrants | Africa | 94.7 /100 | #116 | Exceptional 5.9% |