Japanese vs Immigrants from Netherlands 11th Grade
COMPARE
Japanese
Immigrants from Netherlands
11th Grade
11th Grade Comparison
Japanese
Immigrants from Netherlands
89.9%
11TH GRADE
0.0/ 100
METRIC RATING
299th/ 347
METRIC RANK
93.9%
11TH GRADE
99.8/ 100
METRIC RATING
67th/ 347
METRIC RANK
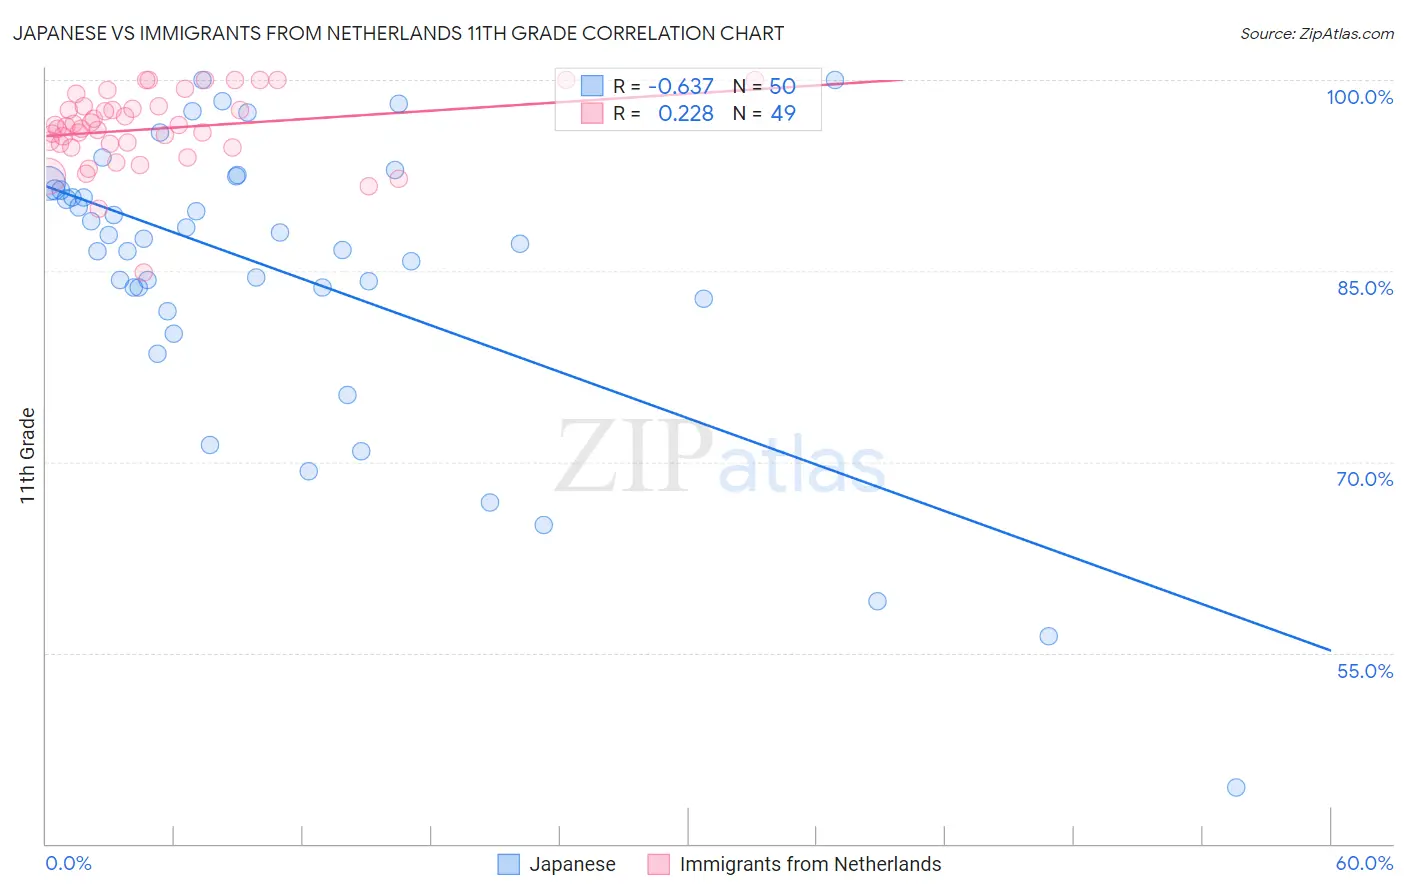
Japanese vs Immigrants from Netherlands 11th Grade Correlation Chart
The statistical analysis conducted on geographies consisting of 249,183,224 people shows a significant negative correlation between the proportion of Japanese and percentage of population with at least 11th grade education in the United States with a correlation coefficient (R) of -0.637 and weighted average of 89.9%. Similarly, the statistical analysis conducted on geographies consisting of 237,869,860 people shows a weak positive correlation between the proportion of Immigrants from Netherlands and percentage of population with at least 11th grade education in the United States with a correlation coefficient (R) of 0.228 and weighted average of 93.9%, a difference of 4.5%.
11th Grade Correlation Summary
| Measurement | Japanese | Immigrants from Netherlands |
| Minimum | 44.4% | 84.9% |
| Maximum | 100.0% | 100.0% |
| Range | 55.6% | 15.1% |
| Mean | 84.8% | 96.2% |
| Median | 87.3% | 96.4% |
| Interquartile 25% (IQ1) | 82.8% | 94.8% |
| Interquartile 75% (IQ3) | 91.4% | 97.9% |
| Interquartile Range (IQR) | 8.6% | 3.1% |
| Standard Deviation (Sample) | 11.5% | 3.0% |
| Standard Deviation (Population) | 11.4% | 3.0% |
Similar Demographics by 11th Grade
Demographics Similar to Japanese by 11th Grade
In terms of 11th grade, the demographic groups most similar to Japanese are Immigrants from Haiti (89.9%, a difference of 0.010%), Guyanese (89.9%, a difference of 0.020%), Immigrants from Fiji (89.9%, a difference of 0.030%), Navajo (90.0%, a difference of 0.10%), and Fijian (90.0%, a difference of 0.14%).
| Demographics | Rating | Rank | 11th Grade |
| Cubans | 0.0 /100 | #292 | Tragic 90.2% |
| Natives/Alaskans | 0.0 /100 | #293 | Tragic 90.2% |
| Immigrants | Grenada | 0.0 /100 | #294 | Tragic 90.1% |
| Immigrants | Vietnam | 0.0 /100 | #295 | Tragic 90.0% |
| Fijians | 0.0 /100 | #296 | Tragic 90.0% |
| Navajo | 0.0 /100 | #297 | Tragic 90.0% |
| Immigrants | Fiji | 0.0 /100 | #298 | Tragic 89.9% |
| Japanese | 0.0 /100 | #299 | Tragic 89.9% |
| Immigrants | Haiti | 0.0 /100 | #300 | Tragic 89.9% |
| Guyanese | 0.0 /100 | #301 | Tragic 89.9% |
| Immigrants | Guyana | 0.0 /100 | #302 | Tragic 89.7% |
| Immigrants | Immigrants | 0.0 /100 | #303 | Tragic 89.7% |
| Yuman | 0.0 /100 | #304 | Tragic 89.7% |
| Immigrants | Cambodia | 0.0 /100 | #305 | Tragic 89.6% |
| Ecuadorians | 0.0 /100 | #306 | Tragic 89.6% |
Demographics Similar to Immigrants from Netherlands by 11th Grade
In terms of 11th grade, the demographic groups most similar to Immigrants from Netherlands are Alaskan Athabascan (93.9%, a difference of 0.0%), Immigrants from Sweden (93.9%, a difference of 0.020%), Native Hawaiian (93.9%, a difference of 0.020%), Zimbabwean (93.9%, a difference of 0.020%), and Scotch-Irish (93.9%, a difference of 0.020%).
| Demographics | Rating | Rank | 11th Grade |
| Okinawans | 99.8 /100 | #60 | Exceptional 94.0% |
| Immigrants | Belgium | 99.8 /100 | #61 | Exceptional 94.0% |
| Austrians | 99.8 /100 | #62 | Exceptional 94.0% |
| Ukrainians | 99.8 /100 | #63 | Exceptional 94.0% |
| Immigrants | Sweden | 99.8 /100 | #64 | Exceptional 93.9% |
| Native Hawaiians | 99.8 /100 | #65 | Exceptional 93.9% |
| Alaskan Athabascans | 99.8 /100 | #66 | Exceptional 93.9% |
| Immigrants | Netherlands | 99.8 /100 | #67 | Exceptional 93.9% |
| Zimbabweans | 99.8 /100 | #68 | Exceptional 93.9% |
| Scotch-Irish | 99.8 /100 | #69 | Exceptional 93.9% |
| Immigrants | England | 99.7 /100 | #70 | Exceptional 93.8% |
| Immigrants | South Africa | 99.7 /100 | #71 | Exceptional 93.8% |
| Immigrants | Japan | 99.7 /100 | #72 | Exceptional 93.8% |
| Romanians | 99.6 /100 | #73 | Exceptional 93.8% |
| Immigrants | Czechoslovakia | 99.6 /100 | #74 | Exceptional 93.8% |