Palestinian vs Immigrants from Netherlands Ambulatory Disability
COMPARE
Palestinian
Immigrants from Netherlands
Ambulatory Disability
Ambulatory Disability Comparison
Palestinians
Immigrants from Netherlands
5.7%
AMBULATORY DISABILITY
99.2/ 100
METRIC RATING
82nd/ 347
METRIC RANK
5.8%
AMBULATORY DISABILITY
97.1/ 100
METRIC RATING
109th/ 347
METRIC RANK
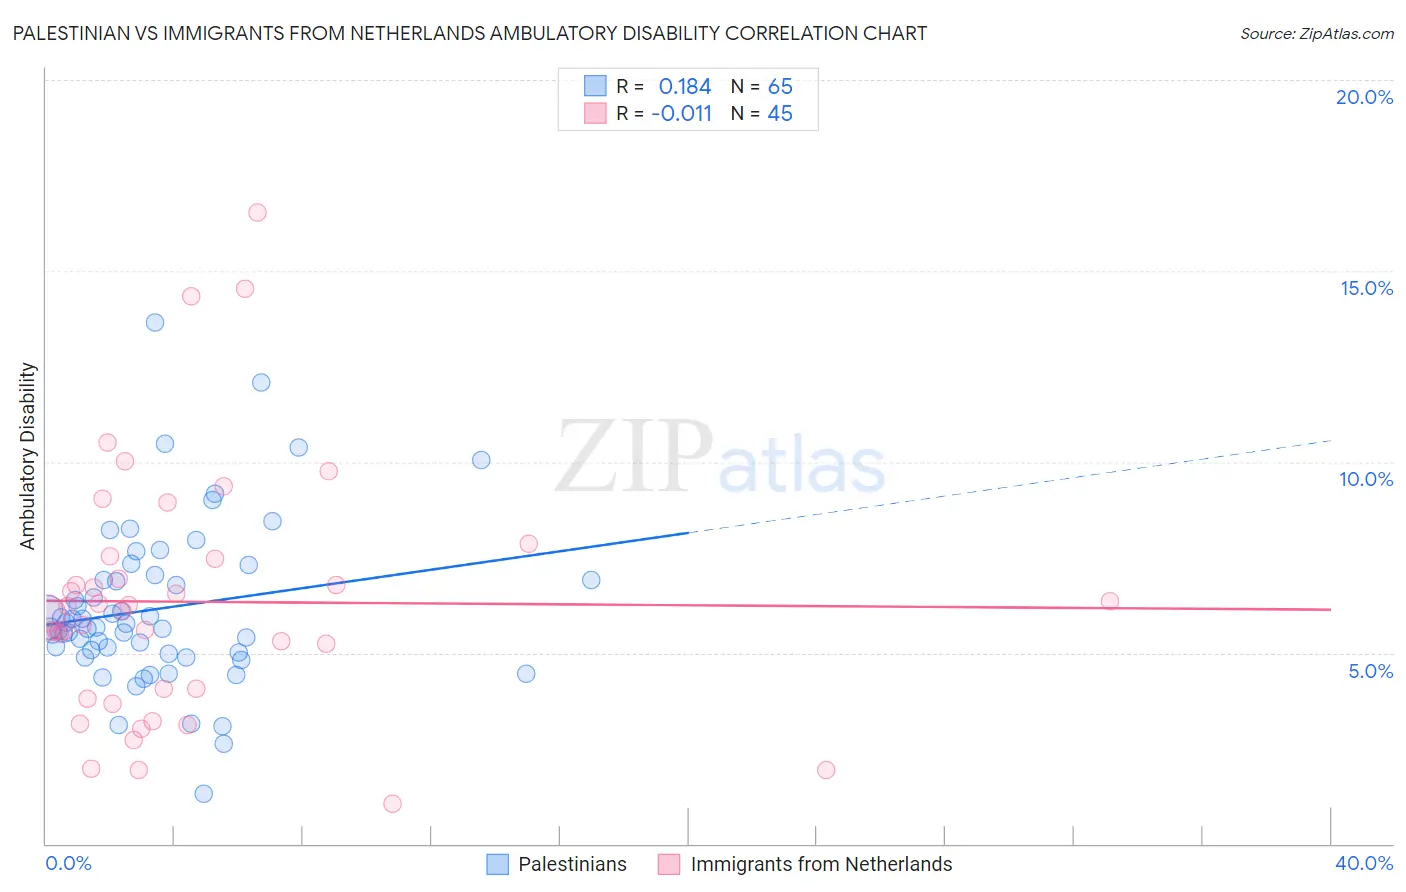
Palestinian vs Immigrants from Netherlands Ambulatory Disability Correlation Chart
The statistical analysis conducted on geographies consisting of 216,450,834 people shows a poor positive correlation between the proportion of Palestinians and percentage of population with ambulatory disability in the United States with a correlation coefficient (R) of 0.184 and weighted average of 5.7%. Similarly, the statistical analysis conducted on geographies consisting of 237,838,654 people shows no correlation between the proportion of Immigrants from Netherlands and percentage of population with ambulatory disability in the United States with a correlation coefficient (R) of -0.011 and weighted average of 5.8%, a difference of 1.8%.
Ambulatory Disability Correlation Summary
| Measurement | Palestinian | Immigrants from Netherlands |
| Minimum | 1.3% | 1.1% |
| Maximum | 13.7% | 16.5% |
| Range | 12.3% | 15.5% |
| Mean | 6.2% | 6.3% |
| Median | 5.7% | 6.1% |
| Interquartile 25% (IQ1) | 5.0% | 3.9% |
| Interquartile 75% (IQ3) | 7.0% | 7.5% |
| Interquartile Range (IQR) | 2.0% | 3.6% |
| Standard Deviation (Sample) | 2.1% | 3.3% |
| Standard Deviation (Population) | 2.1% | 3.3% |
Similar Demographics by Ambulatory Disability
Demographics Similar to Palestinians by Ambulatory Disability
In terms of ambulatory disability, the demographic groups most similar to Palestinians are Immigrants from Jordan (5.7%, a difference of 0.0%), Immigrants from Ireland (5.7%, a difference of 0.010%), Eastern European (5.7%, a difference of 0.020%), Ugandan (5.7%, a difference of 0.020%), and Chilean (5.7%, a difference of 0.14%).
| Demographics | Rating | Rank | Ambulatory Disability |
| Immigrants | South Africa | 99.3 /100 | #75 | Exceptional 5.7% |
| Sudanese | 99.3 /100 | #76 | Exceptional 5.7% |
| Immigrants | Vietnam | 99.3 /100 | #77 | Exceptional 5.7% |
| Somalis | 99.2 /100 | #78 | Exceptional 5.7% |
| Chileans | 99.2 /100 | #79 | Exceptional 5.7% |
| Immigrants | Ireland | 99.2 /100 | #80 | Exceptional 5.7% |
| Immigrants | Jordan | 99.2 /100 | #81 | Exceptional 5.7% |
| Palestinians | 99.2 /100 | #82 | Exceptional 5.7% |
| Eastern Europeans | 99.2 /100 | #83 | Exceptional 5.7% |
| Ugandans | 99.2 /100 | #84 | Exceptional 5.7% |
| South Americans | 99.0 /100 | #85 | Exceptional 5.7% |
| Latvians | 99.0 /100 | #86 | Exceptional 5.7% |
| Immigrants | Chile | 98.9 /100 | #87 | Exceptional 5.8% |
| Soviet Union | 98.9 /100 | #88 | Exceptional 5.8% |
| Bhutanese | 98.8 /100 | #89 | Exceptional 5.8% |
Demographics Similar to Immigrants from Netherlands by Ambulatory Disability
In terms of ambulatory disability, the demographic groups most similar to Immigrants from Netherlands are Colombian (5.8%, a difference of 0.020%), Uruguayan (5.8%, a difference of 0.030%), Immigrants from Morocco (5.8%, a difference of 0.080%), Immigrants from Czechoslovakia (5.8%, a difference of 0.15%), and Immigrants from Colombia (5.8%, a difference of 0.18%).
| Demographics | Rating | Rank | Ambulatory Disability |
| Immigrants | Kenya | 97.8 /100 | #102 | Exceptional 5.8% |
| Immigrants | Romania | 97.7 /100 | #103 | Exceptional 5.8% |
| New Zealanders | 97.6 /100 | #104 | Exceptional 5.8% |
| Immigrants | Czechoslovakia | 97.4 /100 | #105 | Exceptional 5.8% |
| Immigrants | Morocco | 97.3 /100 | #106 | Exceptional 5.8% |
| Uruguayans | 97.2 /100 | #107 | Exceptional 5.8% |
| Colombians | 97.2 /100 | #108 | Exceptional 5.8% |
| Immigrants | Netherlands | 97.1 /100 | #109 | Exceptional 5.8% |
| Immigrants | Colombia | 96.7 /100 | #110 | Exceptional 5.8% |
| Danes | 96.6 /100 | #111 | Exceptional 5.8% |
| South Africans | 96.3 /100 | #112 | Exceptional 5.9% |
| Immigrants | Uruguay | 95.6 /100 | #113 | Exceptional 5.9% |
| Immigrants | Poland | 95.4 /100 | #114 | Exceptional 5.9% |
| South American Indians | 94.8 /100 | #115 | Exceptional 5.9% |
| Immigrants | Africa | 94.7 /100 | #116 | Exceptional 5.9% |