Inupiat vs Immigrants from Latvia 1 or more Vehicles in Household
COMPARE
Inupiat
Immigrants from Latvia
1 or more Vehicles in Household
1 or more Vehicles in Household Comparison
Inupiat
Immigrants from Latvia
71.5%
1 OR MORE VEHICLES IN HOUSEHOLD
0.0/ 100
METRIC RATING
338th/ 347
METRIC RANK
88.1%
1 OR MORE VEHICLES IN HOUSEHOLD
0.9/ 100
METRIC RATING
255th/ 347
METRIC RANK
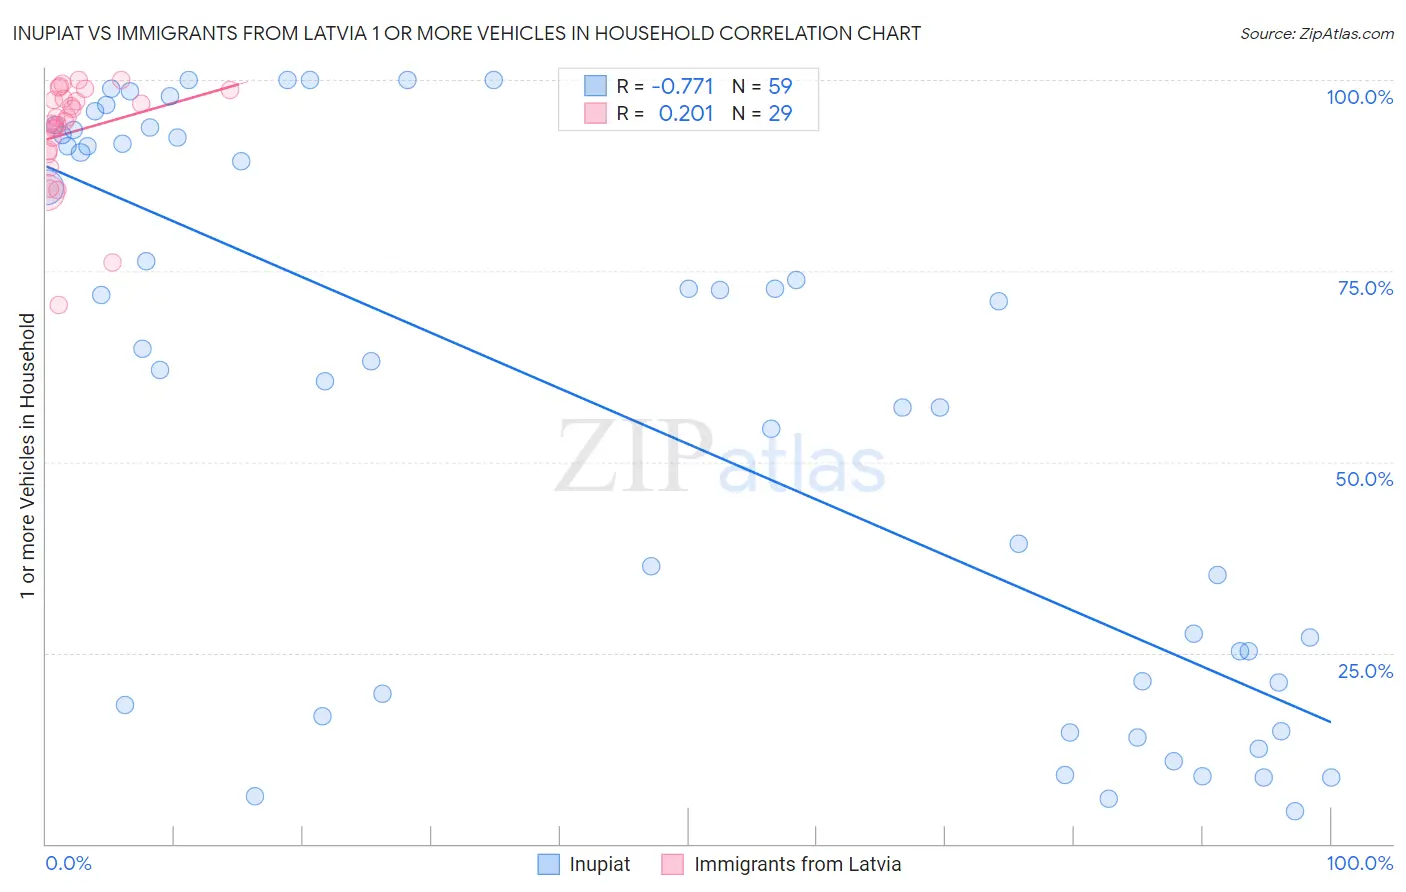
Inupiat vs Immigrants from Latvia 1 or more Vehicles in Household Correlation Chart
The statistical analysis conducted on geographies consisting of 96,318,712 people shows a strong negative correlation between the proportion of Inupiat and percentage of households with 1 or more vehicles available in the United States with a correlation coefficient (R) of -0.771 and weighted average of 71.5%. Similarly, the statistical analysis conducted on geographies consisting of 113,728,237 people shows a weak positive correlation between the proportion of Immigrants from Latvia and percentage of households with 1 or more vehicles available in the United States with a correlation coefficient (R) of 0.201 and weighted average of 88.1%, a difference of 23.1%.
1 or more Vehicles in Household Correlation Summary
| Measurement | Inupiat | Immigrants from Latvia |
| Minimum | 4.2% | 70.5% |
| Maximum | 100.0% | 100.0% |
| Range | 95.8% | 29.5% |
| Mean | 56.9% | 93.2% |
| Median | 63.2% | 95.0% |
| Interquartile 25% (IQ1) | 19.7% | 90.6% |
| Interquartile 75% (IQ3) | 92.5% | 98.1% |
| Interquartile Range (IQR) | 72.8% | 7.5% |
| Standard Deviation (Sample) | 35.1% | 7.0% |
| Standard Deviation (Population) | 34.8% | 6.9% |
Similar Demographics by 1 or more Vehicles in Household
Demographics Similar to Inupiat by 1 or more Vehicles in Household
In terms of 1 or more vehicles in household, the demographic groups most similar to Inupiat are Guyanese (70.8%, a difference of 1.0%), Dominican (70.7%, a difference of 1.2%), Immigrants from Barbados (70.6%, a difference of 1.3%), Immigrants from Guyana (70.6%, a difference of 1.4%), and British West Indian (70.4%, a difference of 1.7%).
| Demographics | Rating | Rank | 1 or more Vehicles in Household |
| West Indians | 0.0 /100 | #331 | Tragic 76.4% |
| Trinidadians and Tobagonians | 0.0 /100 | #332 | Tragic 76.3% |
| Immigrants | Ecuador | 0.0 /100 | #333 | Tragic 76.2% |
| Immigrants | Bangladesh | 0.0 /100 | #334 | Tragic 74.3% |
| Barbadians | 0.0 /100 | #335 | Tragic 74.0% |
| Vietnamese | 0.0 /100 | #336 | Tragic 73.8% |
| Immigrants | Uzbekistan | 0.0 /100 | #337 | Tragic 73.4% |
| Inupiat | 0.0 /100 | #338 | Tragic 71.5% |
| Guyanese | 0.0 /100 | #339 | Tragic 70.8% |
| Dominicans | 0.0 /100 | #340 | Tragic 70.7% |
| Immigrants | Barbados | 0.0 /100 | #341 | Tragic 70.6% |
| Immigrants | Guyana | 0.0 /100 | #342 | Tragic 70.6% |
| British West Indians | 0.0 /100 | #343 | Tragic 70.4% |
| Immigrants | Dominican Republic | 0.0 /100 | #344 | Tragic 68.6% |
| Immigrants | St. Vincent and the Grenadines | 0.0 /100 | #345 | Tragic 64.7% |
Demographics Similar to Immigrants from Latvia by 1 or more Vehicles in Household
In terms of 1 or more vehicles in household, the demographic groups most similar to Immigrants from Latvia are Colombian (88.0%, a difference of 0.010%), Liberian (88.0%, a difference of 0.010%), South American Indian (88.0%, a difference of 0.010%), Haitian (88.1%, a difference of 0.020%), and Honduran (88.1%, a difference of 0.030%).
| Demographics | Rating | Rank | 1 or more Vehicles in Household |
| Immigrants | Nigeria | 1.5 /100 | #248 | Tragic 88.2% |
| Blacks/African Americans | 1.4 /100 | #249 | Tragic 88.2% |
| Egyptians | 1.2 /100 | #250 | Tragic 88.2% |
| Immigrants | Serbia | 1.2 /100 | #251 | Tragic 88.2% |
| Immigrants | Uruguay | 1.1 /100 | #252 | Tragic 88.1% |
| Hondurans | 1.0 /100 | #253 | Tragic 88.1% |
| Haitians | 0.9 /100 | #254 | Tragic 88.1% |
| Immigrants | Latvia | 0.9 /100 | #255 | Tragic 88.1% |
| Colombians | 0.9 /100 | #256 | Tragic 88.0% |
| Liberians | 0.9 /100 | #257 | Tragic 88.0% |
| South American Indians | 0.9 /100 | #258 | Tragic 88.0% |
| Nigerians | 0.8 /100 | #259 | Tragic 88.0% |
| Macedonians | 0.6 /100 | #260 | Tragic 87.9% |
| Immigrants | Switzerland | 0.6 /100 | #261 | Tragic 87.9% |
| Sub-Saharan Africans | 0.5 /100 | #262 | Tragic 87.9% |