Moroccan vs Immigrants from Latvia Male Disability
COMPARE
Moroccan
Immigrants from Latvia
Male Disability
Male Disability Comparison
Moroccans
Immigrants from Latvia
11.0%
MALE DISABILITY
80.7/ 100
METRIC RATING
143rd/ 347
METRIC RANK
10.9%
MALE DISABILITY
85.5/ 100
METRIC RATING
128th/ 347
METRIC RANK
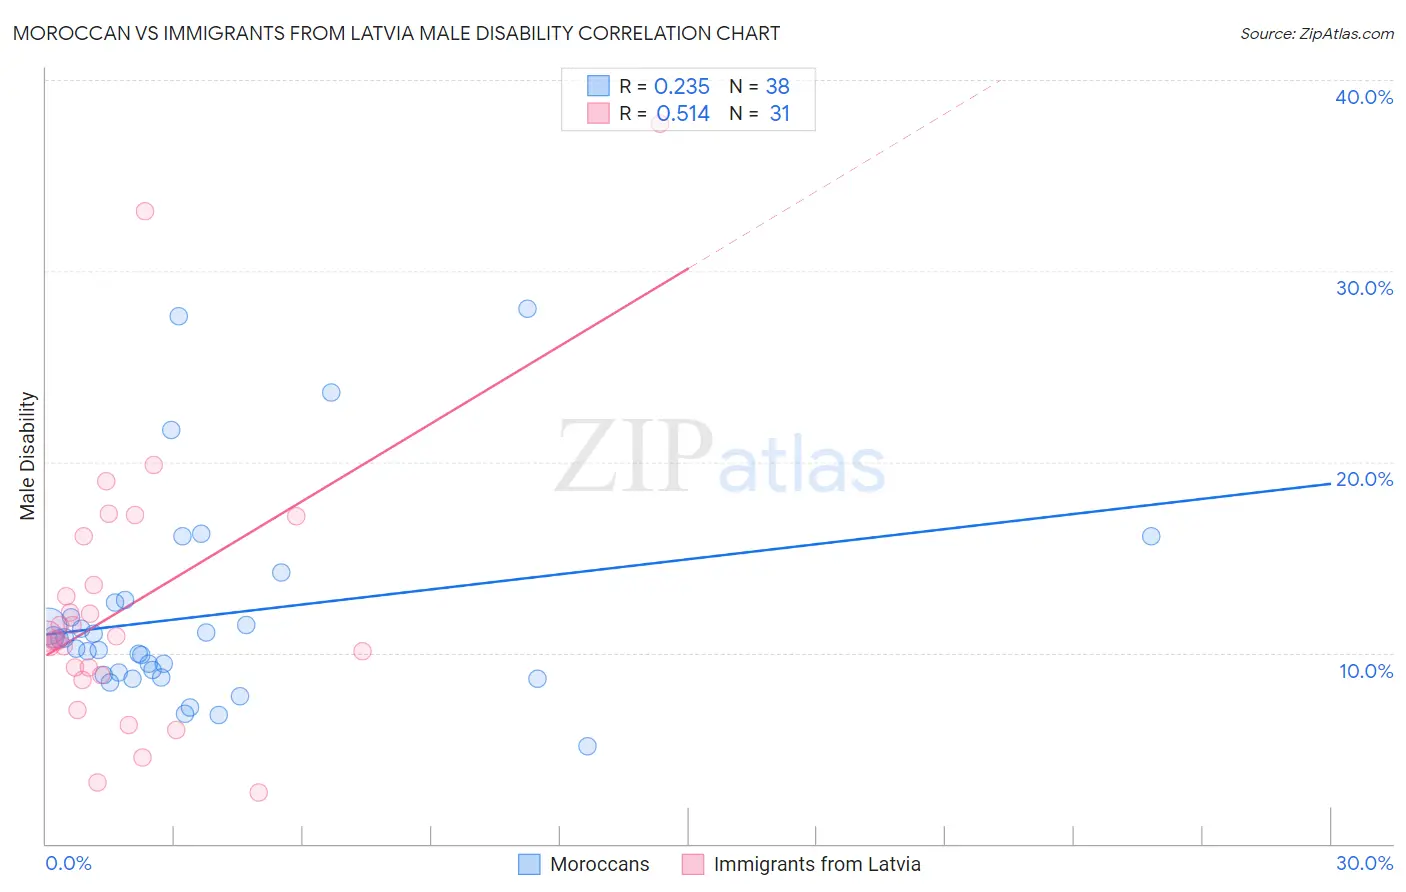
Moroccan vs Immigrants from Latvia Male Disability Correlation Chart
The statistical analysis conducted on geographies consisting of 201,806,730 people shows a weak positive correlation between the proportion of Moroccans and percentage of males with a disability in the United States with a correlation coefficient (R) of 0.235 and weighted average of 11.0%. Similarly, the statistical analysis conducted on geographies consisting of 113,739,259 people shows a substantial positive correlation between the proportion of Immigrants from Latvia and percentage of males with a disability in the United States with a correlation coefficient (R) of 0.514 and weighted average of 10.9%, a difference of 0.48%.
Male Disability Correlation Summary
| Measurement | Moroccan | Immigrants from Latvia |
| Minimum | 5.1% | 2.7% |
| Maximum | 28.0% | 37.7% |
| Range | 22.9% | 35.1% |
| Mean | 11.9% | 12.6% |
| Median | 10.5% | 10.8% |
| Interquartile 25% (IQ1) | 8.8% | 8.9% |
| Interquartile 75% (IQ3) | 12.6% | 16.1% |
| Interquartile Range (IQR) | 3.8% | 7.2% |
| Standard Deviation (Sample) | 5.3% | 7.5% |
| Standard Deviation (Population) | 5.2% | 7.4% |
Demographics Similar to Moroccans and Immigrants from Latvia by Male Disability
In terms of male disability, the demographic groups most similar to Moroccans are Immigrants from Italy (11.0%, a difference of 0.070%), Arab (11.0%, a difference of 0.070%), Immigrants from Sudan (11.0%, a difference of 0.070%), South African (11.0%, a difference of 0.090%), and Nigerian (11.0%, a difference of 0.11%). Similarly, the demographic groups most similar to Immigrants from Latvia are Immigrants from Philippines (10.9%, a difference of 0.0%), Brazilian (10.9%, a difference of 0.0%), Macedonian (11.0%, a difference of 0.14%), Immigrants from Ukraine (10.9%, a difference of 0.16%), and Immigrants from Fiji (11.0%, a difference of 0.16%).
| Demographics | Rating | Rank | Male Disability |
| Immigrants | North Macedonia | 88.1 /100 | #125 | Excellent 10.9% |
| Immigrants | Trinidad and Tobago | 86.9 /100 | #126 | Excellent 10.9% |
| Immigrants | Ukraine | 86.8 /100 | #127 | Excellent 10.9% |
| Immigrants | Latvia | 85.5 /100 | #128 | Excellent 10.9% |
| Immigrants | Philippines | 85.4 /100 | #129 | Excellent 10.9% |
| Brazilians | 85.4 /100 | #130 | Excellent 10.9% |
| Macedonians | 84.2 /100 | #131 | Excellent 11.0% |
| Immigrants | Fiji | 84.0 /100 | #132 | Excellent 11.0% |
| Ugandans | 83.9 /100 | #133 | Excellent 11.0% |
| Bhutanese | 83.4 /100 | #134 | Excellent 11.0% |
| Trinidadians and Tobagonians | 83.3 /100 | #135 | Excellent 11.0% |
| Immigrants | Costa Rica | 82.8 /100 | #136 | Excellent 11.0% |
| Immigrants | Europe | 82.0 /100 | #137 | Excellent 11.0% |
| Nigerians | 81.9 /100 | #138 | Excellent 11.0% |
| South Africans | 81.7 /100 | #139 | Excellent 11.0% |
| Immigrants | Italy | 81.5 /100 | #140 | Excellent 11.0% |
| Arabs | 81.5 /100 | #141 | Excellent 11.0% |
| Immigrants | Sudan | 81.5 /100 | #142 | Excellent 11.0% |
| Moroccans | 80.7 /100 | #143 | Excellent 11.0% |
| Kenyans | 78.1 /100 | #144 | Good 11.0% |
| Costa Ricans | 78.0 /100 | #145 | Good 11.0% |