Spanish vs Immigrants from Latvia Male Disability
COMPARE
Spanish
Immigrants from Latvia
Male Disability
Male Disability Comparison
Spanish
Immigrants from Latvia
12.7%
MALE DISABILITY
0.0/ 100
METRIC RATING
284th/ 347
METRIC RANK
10.9%
MALE DISABILITY
85.5/ 100
METRIC RATING
128th/ 347
METRIC RANK
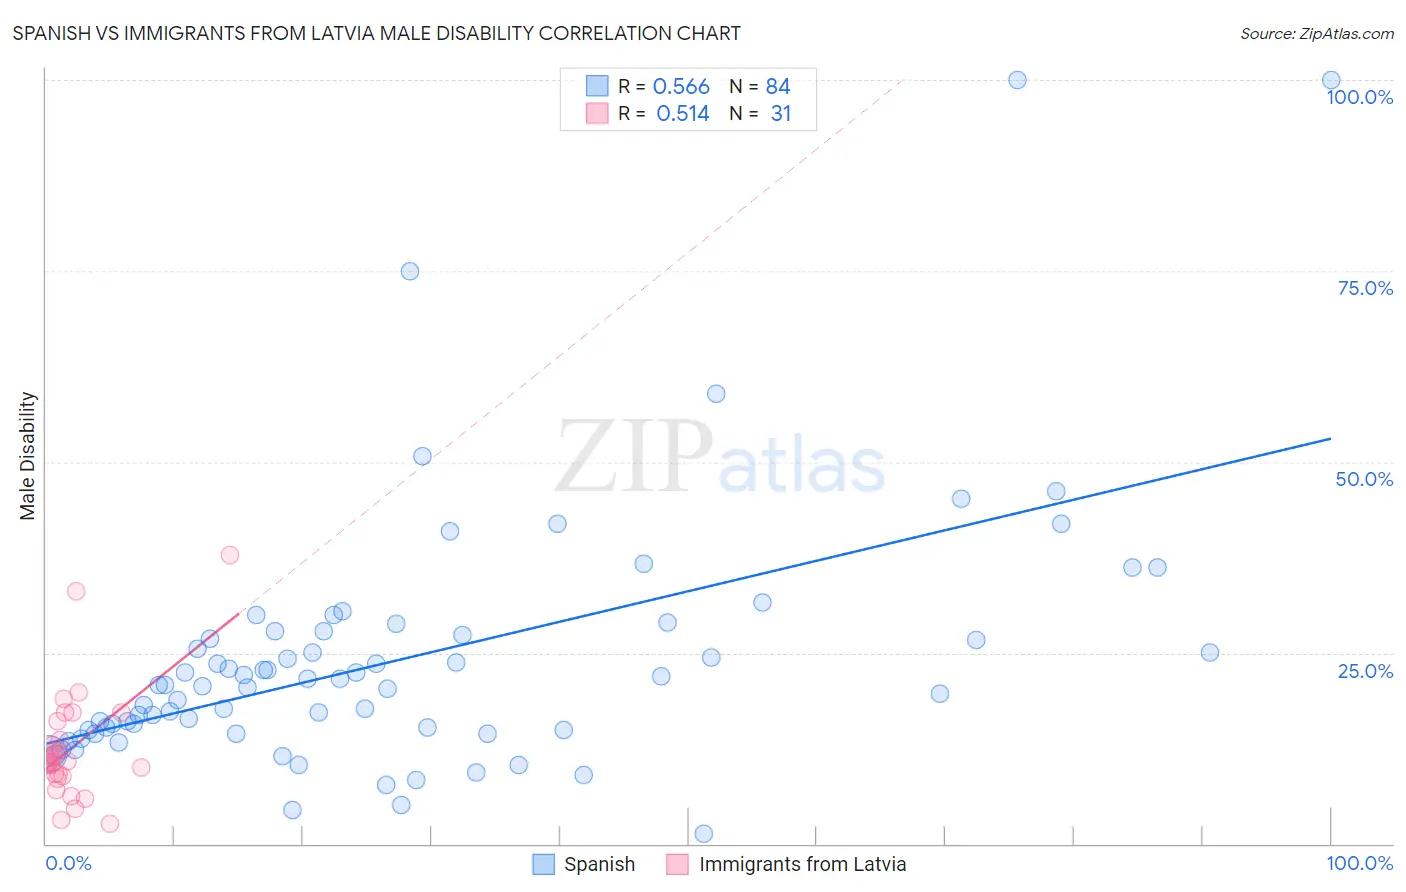
Spanish vs Immigrants from Latvia Male Disability Correlation Chart
The statistical analysis conducted on geographies consisting of 422,078,058 people shows a substantial positive correlation between the proportion of Spanish and percentage of males with a disability in the United States with a correlation coefficient (R) of 0.566 and weighted average of 12.7%. Similarly, the statistical analysis conducted on geographies consisting of 113,739,259 people shows a substantial positive correlation between the proportion of Immigrants from Latvia and percentage of males with a disability in the United States with a correlation coefficient (R) of 0.514 and weighted average of 10.9%, a difference of 16.5%.
Male Disability Correlation Summary
| Measurement | Spanish | Immigrants from Latvia |
| Minimum | 1.3% | 2.7% |
| Maximum | 100.0% | 37.7% |
| Range | 98.7% | 35.1% |
| Mean | 24.2% | 12.6% |
| Median | 20.8% | 10.8% |
| Interquartile 25% (IQ1) | 14.9% | 8.9% |
| Interquartile 75% (IQ3) | 27.5% | 16.1% |
| Interquartile Range (IQR) | 12.6% | 7.2% |
| Standard Deviation (Sample) | 16.9% | 7.5% |
| Standard Deviation (Population) | 16.8% | 7.4% |
Similar Demographics by Male Disability
Demographics Similar to Spanish by Male Disability
In terms of male disability, the demographic groups most similar to Spanish are Welsh (12.7%, a difference of 0.0%), Scottish (12.8%, a difference of 0.060%), Cape Verdean (12.8%, a difference of 0.13%), German (12.7%, a difference of 0.27%), and Irish (12.7%, a difference of 0.28%).
| Demographics | Rating | Rank | Male Disability |
| Finns | 0.0 /100 | #277 | Tragic 12.6% |
| Central American Indians | 0.0 /100 | #278 | Tragic 12.7% |
| Slovaks | 0.0 /100 | #279 | Tragic 12.7% |
| Dutch | 0.0 /100 | #280 | Tragic 12.7% |
| Sioux | 0.0 /100 | #281 | Tragic 12.7% |
| Irish | 0.0 /100 | #282 | Tragic 12.7% |
| Germans | 0.0 /100 | #283 | Tragic 12.7% |
| Spanish | 0.0 /100 | #284 | Tragic 12.7% |
| Welsh | 0.0 /100 | #285 | Tragic 12.7% |
| Scottish | 0.0 /100 | #286 | Tragic 12.8% |
| Cape Verdeans | 0.0 /100 | #287 | Tragic 12.8% |
| Yup'ik | 0.0 /100 | #288 | Tragic 12.8% |
| Immigrants | Cabo Verde | 0.0 /100 | #289 | Tragic 12.8% |
| Pima | 0.0 /100 | #290 | Tragic 12.8% |
| Whites/Caucasians | 0.0 /100 | #291 | Tragic 12.8% |
Demographics Similar to Immigrants from Latvia by Male Disability
In terms of male disability, the demographic groups most similar to Immigrants from Latvia are Immigrants from Philippines (10.9%, a difference of 0.0%), Brazilian (10.9%, a difference of 0.0%), Macedonian (11.0%, a difference of 0.14%), Immigrants from Ukraine (10.9%, a difference of 0.16%), and Immigrants from Fiji (11.0%, a difference of 0.16%).
| Demographics | Rating | Rank | Male Disability |
| Immigrants | South Eastern Asia | 89.2 /100 | #121 | Excellent 10.9% |
| Immigrants | Ghana | 89.0 /100 | #122 | Excellent 10.9% |
| Immigrants | Czechoslovakia | 88.4 /100 | #123 | Excellent 10.9% |
| South American Indians | 88.1 /100 | #124 | Excellent 10.9% |
| Immigrants | North Macedonia | 88.1 /100 | #125 | Excellent 10.9% |
| Immigrants | Trinidad and Tobago | 86.9 /100 | #126 | Excellent 10.9% |
| Immigrants | Ukraine | 86.8 /100 | #127 | Excellent 10.9% |
| Immigrants | Latvia | 85.5 /100 | #128 | Excellent 10.9% |
| Immigrants | Philippines | 85.4 /100 | #129 | Excellent 10.9% |
| Brazilians | 85.4 /100 | #130 | Excellent 10.9% |
| Macedonians | 84.2 /100 | #131 | Excellent 11.0% |
| Immigrants | Fiji | 84.0 /100 | #132 | Excellent 11.0% |
| Ugandans | 83.9 /100 | #133 | Excellent 11.0% |
| Bhutanese | 83.4 /100 | #134 | Excellent 11.0% |
| Trinidadians and Tobagonians | 83.3 /100 | #135 | Excellent 11.0% |