Inupiat vs Immigrants from Latvia Unemployment
COMPARE
Inupiat
Immigrants from Latvia
Unemployment
Unemployment Comparison
Inupiat
Immigrants from Latvia
10.1%
UNEMPLOYMENT
0.0/ 100
METRIC RATING
345th/ 347
METRIC RANK
5.1%
UNEMPLOYMENT
88.0/ 100
METRIC RATING
129th/ 347
METRIC RANK
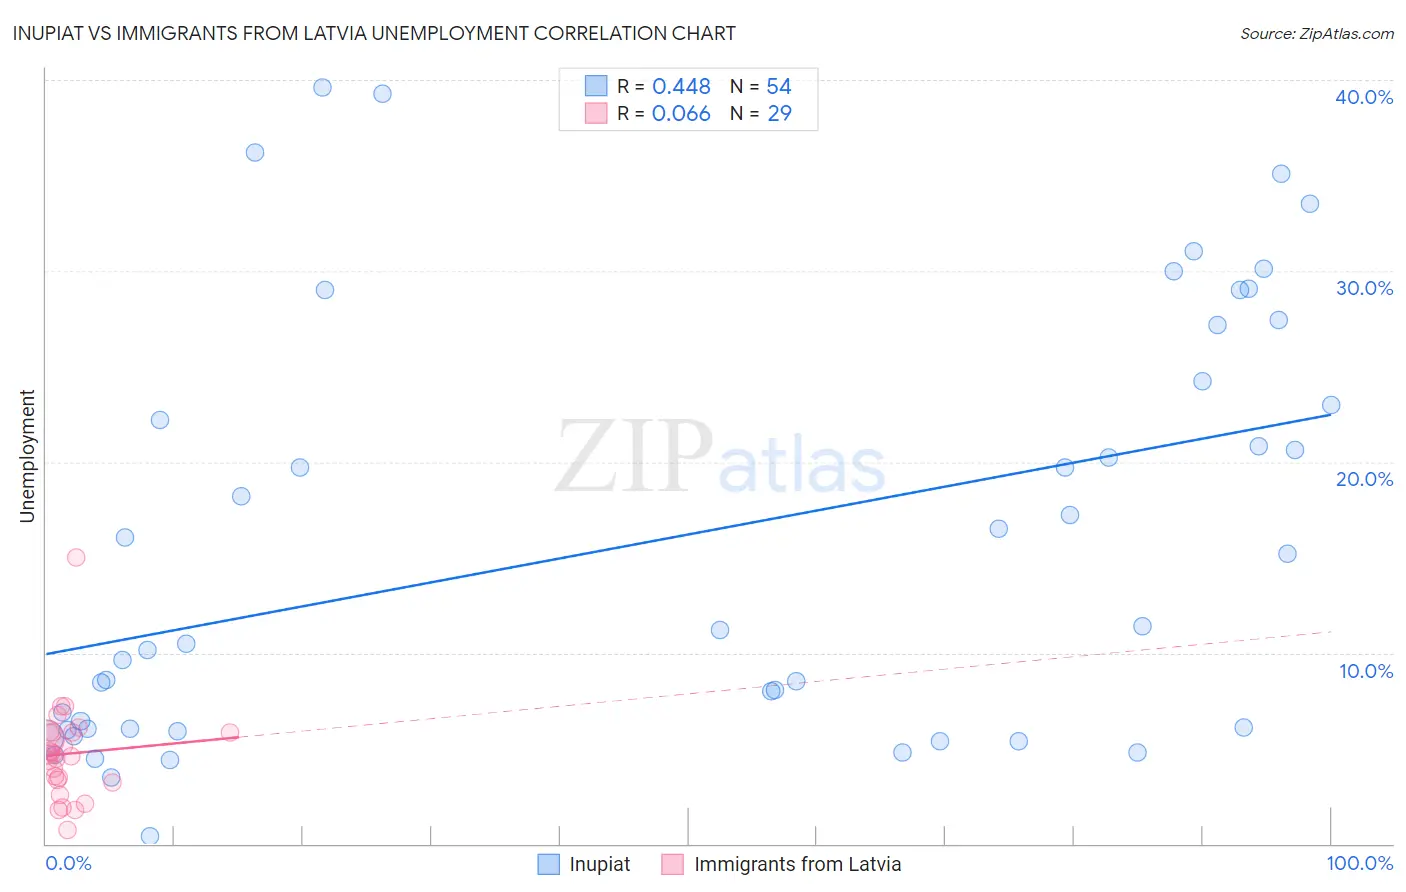
Inupiat vs Immigrants from Latvia Unemployment Correlation Chart
The statistical analysis conducted on geographies consisting of 96,296,891 people shows a moderate positive correlation between the proportion of Inupiat and unemployment in the United States with a correlation coefficient (R) of 0.448 and weighted average of 10.1%. Similarly, the statistical analysis conducted on geographies consisting of 113,721,061 people shows a slight positive correlation between the proportion of Immigrants from Latvia and unemployment in the United States with a correlation coefficient (R) of 0.066 and weighted average of 5.1%, a difference of 98.4%.
Unemployment Correlation Summary
| Measurement | Inupiat | Immigrants from Latvia |
| Minimum | 0.40% | 0.70% |
| Maximum | 39.6% | 15.0% |
| Range | 39.2% | 14.3% |
| Mean | 15.9% | 4.7% |
| Median | 11.3% | 4.6% |
| Interquartile 25% (IQ1) | 6.0% | 3.3% |
| Interquartile 75% (IQ3) | 24.2% | 5.8% |
| Interquartile Range (IQR) | 18.2% | 2.5% |
| Standard Deviation (Sample) | 11.0% | 2.6% |
| Standard Deviation (Population) | 10.9% | 2.6% |
Similar Demographics by Unemployment
Demographics Similar to Inupiat by Unemployment
In terms of unemployment, the demographic groups most similar to Inupiat are Arapaho (9.8%, a difference of 2.9%), Crow (11.1%, a difference of 9.4%), Yuman (9.1%, a difference of 11.6%), Hopi (8.9%, a difference of 13.5%), and Tohono O'odham (8.9%, a difference of 14.0%).
| Demographics | Rating | Rank | Unemployment |
| Immigrants | Dominican Republic | 0.0 /100 | #333 | Tragic 7.4% |
| Apache | 0.0 /100 | #334 | Tragic 7.4% |
| Alaskan Athabascans | 0.0 /100 | #335 | Tragic 7.7% |
| Immigrants | Yemen | 0.0 /100 | #336 | Tragic 7.7% |
| Cheyenne | 0.0 /100 | #337 | Tragic 8.0% |
| Pima | 0.0 /100 | #338 | Tragic 8.2% |
| Navajo | 0.0 /100 | #339 | Tragic 8.4% |
| Puerto Ricans | 0.0 /100 | #340 | Tragic 8.4% |
| Tohono O'odham | 0.0 /100 | #341 | Tragic 8.9% |
| Hopi | 0.0 /100 | #342 | Tragic 8.9% |
| Yuman | 0.0 /100 | #343 | Tragic 9.1% |
| Arapaho | 0.0 /100 | #344 | Tragic 9.8% |
| Inupiat | 0.0 /100 | #345 | Tragic 10.1% |
| Crow | 0.0 /100 | #346 | Tragic 11.1% |
| Yup'ik | 0.0 /100 | #347 | Tragic 13.6% |
Demographics Similar to Immigrants from Latvia by Unemployment
In terms of unemployment, the demographic groups most similar to Immigrants from Latvia are Immigrants from Eastern Africa (5.1%, a difference of 0.0%), Kenyan (5.1%, a difference of 0.020%), Immigrants from Kenya (5.1%, a difference of 0.020%), Immigrants from Eastern Asia (5.1%, a difference of 0.040%), and Ethiopian (5.1%, a difference of 0.090%).
| Demographics | Rating | Rank | Unemployment |
| Immigrants | Switzerland | 89.1 /100 | #122 | Excellent 5.1% |
| Asians | 89.0 /100 | #123 | Excellent 5.1% |
| Ethiopians | 88.6 /100 | #124 | Excellent 5.1% |
| Immigrants | Eastern Asia | 88.3 /100 | #125 | Excellent 5.1% |
| Kenyans | 88.2 /100 | #126 | Excellent 5.1% |
| Immigrants | Kenya | 88.2 /100 | #127 | Excellent 5.1% |
| Immigrants | Eastern Africa | 88.1 /100 | #128 | Excellent 5.1% |
| Immigrants | Latvia | 88.0 /100 | #129 | Excellent 5.1% |
| Iranians | 86.9 /100 | #130 | Excellent 5.1% |
| Immigrants | Croatia | 86.8 /100 | #131 | Excellent 5.1% |
| Immigrants | Ethiopia | 86.7 /100 | #132 | Excellent 5.1% |
| Immigrants | Jordan | 86.6 /100 | #133 | Excellent 5.1% |
| Immigrants | Europe | 86.3 /100 | #134 | Excellent 5.1% |
| Immigrants | Burma/Myanmar | 86.2 /100 | #135 | Excellent 5.1% |
| Immigrants | Spain | 86.2 /100 | #136 | Excellent 5.1% |