Syrian vs Immigrants from Latvia Male Disability
COMPARE
Syrian
Immigrants from Latvia
Male Disability
Male Disability Comparison
Syrians
Immigrants from Latvia
11.2%
MALE DISABILITY
46.6/ 100
METRIC RATING
176th/ 347
METRIC RANK
10.9%
MALE DISABILITY
85.5/ 100
METRIC RATING
128th/ 347
METRIC RANK
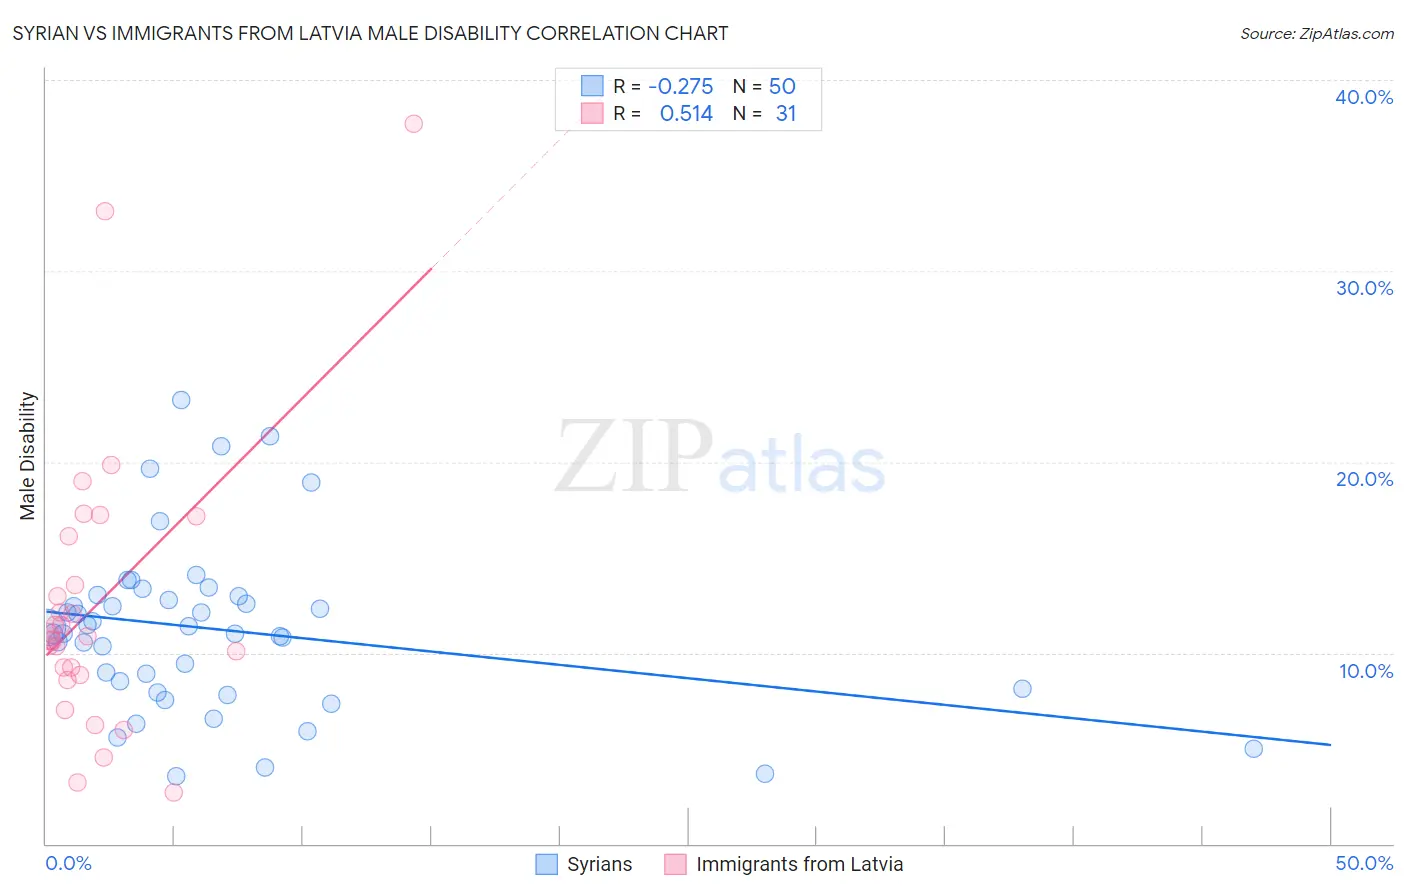
Syrian vs Immigrants from Latvia Male Disability Correlation Chart
The statistical analysis conducted on geographies consisting of 266,314,155 people shows a weak negative correlation between the proportion of Syrians and percentage of males with a disability in the United States with a correlation coefficient (R) of -0.275 and weighted average of 11.2%. Similarly, the statistical analysis conducted on geographies consisting of 113,739,259 people shows a substantial positive correlation between the proportion of Immigrants from Latvia and percentage of males with a disability in the United States with a correlation coefficient (R) of 0.514 and weighted average of 10.9%, a difference of 2.7%.
Male Disability Correlation Summary
| Measurement | Syrian | Immigrants from Latvia |
| Minimum | 3.5% | 2.7% |
| Maximum | 23.2% | 37.7% |
| Range | 19.7% | 35.1% |
| Mean | 11.2% | 12.6% |
| Median | 11.2% | 10.8% |
| Interquartile 25% (IQ1) | 8.1% | 8.9% |
| Interquartile 75% (IQ3) | 12.9% | 16.1% |
| Interquartile Range (IQR) | 4.8% | 7.2% |
| Standard Deviation (Sample) | 4.4% | 7.5% |
| Standard Deviation (Population) | 4.4% | 7.4% |
Similar Demographics by Male Disability
Demographics Similar to Syrians by Male Disability
In terms of male disability, the demographic groups most similar to Syrians are Immigrants from Honduras (11.2%, a difference of 0.12%), Immigrants from Norway (11.3%, a difference of 0.13%), Maltese (11.2%, a difference of 0.19%), Immigrants from Burma/Myanmar (11.2%, a difference of 0.21%), and Romanian (11.2%, a difference of 0.23%).
| Demographics | Rating | Rank | Male Disability |
| Barbadians | 53.4 /100 | #169 | Average 11.2% |
| New Zealanders | 52.9 /100 | #170 | Average 11.2% |
| Haitians | 52.5 /100 | #171 | Average 11.2% |
| Romanians | 50.7 /100 | #172 | Average 11.2% |
| Immigrants | Burma/Myanmar | 50.4 /100 | #173 | Average 11.2% |
| Maltese | 50.0 /100 | #174 | Average 11.2% |
| Immigrants | Honduras | 48.7 /100 | #175 | Average 11.2% |
| Syrians | 46.6 /100 | #176 | Average 11.2% |
| Immigrants | Norway | 44.2 /100 | #177 | Average 11.3% |
| Australians | 42.2 /100 | #178 | Average 11.3% |
| Immigrants | Caribbean | 41.4 /100 | #179 | Average 11.3% |
| Hondurans | 41.1 /100 | #180 | Average 11.3% |
| Immigrants | Senegal | 34.4 /100 | #181 | Fair 11.3% |
| Immigrants | Belize | 33.7 /100 | #182 | Fair 11.3% |
| Immigrants | Central America | 32.9 /100 | #183 | Fair 11.3% |
Demographics Similar to Immigrants from Latvia by Male Disability
In terms of male disability, the demographic groups most similar to Immigrants from Latvia are Immigrants from Philippines (10.9%, a difference of 0.0%), Brazilian (10.9%, a difference of 0.0%), Macedonian (11.0%, a difference of 0.14%), Immigrants from Ukraine (10.9%, a difference of 0.16%), and Immigrants from Fiji (11.0%, a difference of 0.16%).
| Demographics | Rating | Rank | Male Disability |
| Immigrants | South Eastern Asia | 89.2 /100 | #121 | Excellent 10.9% |
| Immigrants | Ghana | 89.0 /100 | #122 | Excellent 10.9% |
| Immigrants | Czechoslovakia | 88.4 /100 | #123 | Excellent 10.9% |
| South American Indians | 88.1 /100 | #124 | Excellent 10.9% |
| Immigrants | North Macedonia | 88.1 /100 | #125 | Excellent 10.9% |
| Immigrants | Trinidad and Tobago | 86.9 /100 | #126 | Excellent 10.9% |
| Immigrants | Ukraine | 86.8 /100 | #127 | Excellent 10.9% |
| Immigrants | Latvia | 85.5 /100 | #128 | Excellent 10.9% |
| Immigrants | Philippines | 85.4 /100 | #129 | Excellent 10.9% |
| Brazilians | 85.4 /100 | #130 | Excellent 10.9% |
| Macedonians | 84.2 /100 | #131 | Excellent 11.0% |
| Immigrants | Fiji | 84.0 /100 | #132 | Excellent 11.0% |
| Ugandans | 83.9 /100 | #133 | Excellent 11.0% |
| Bhutanese | 83.4 /100 | #134 | Excellent 11.0% |
| Trinidadians and Tobagonians | 83.3 /100 | #135 | Excellent 11.0% |