Panamanian vs Immigrants from Latvia Male Disability
COMPARE
Panamanian
Immigrants from Latvia
Male Disability
Male Disability Comparison
Panamanians
Immigrants from Latvia
11.7%
MALE DISABILITY
3.8/ 100
METRIC RATING
219th/ 347
METRIC RANK
10.9%
MALE DISABILITY
85.5/ 100
METRIC RATING
128th/ 347
METRIC RANK
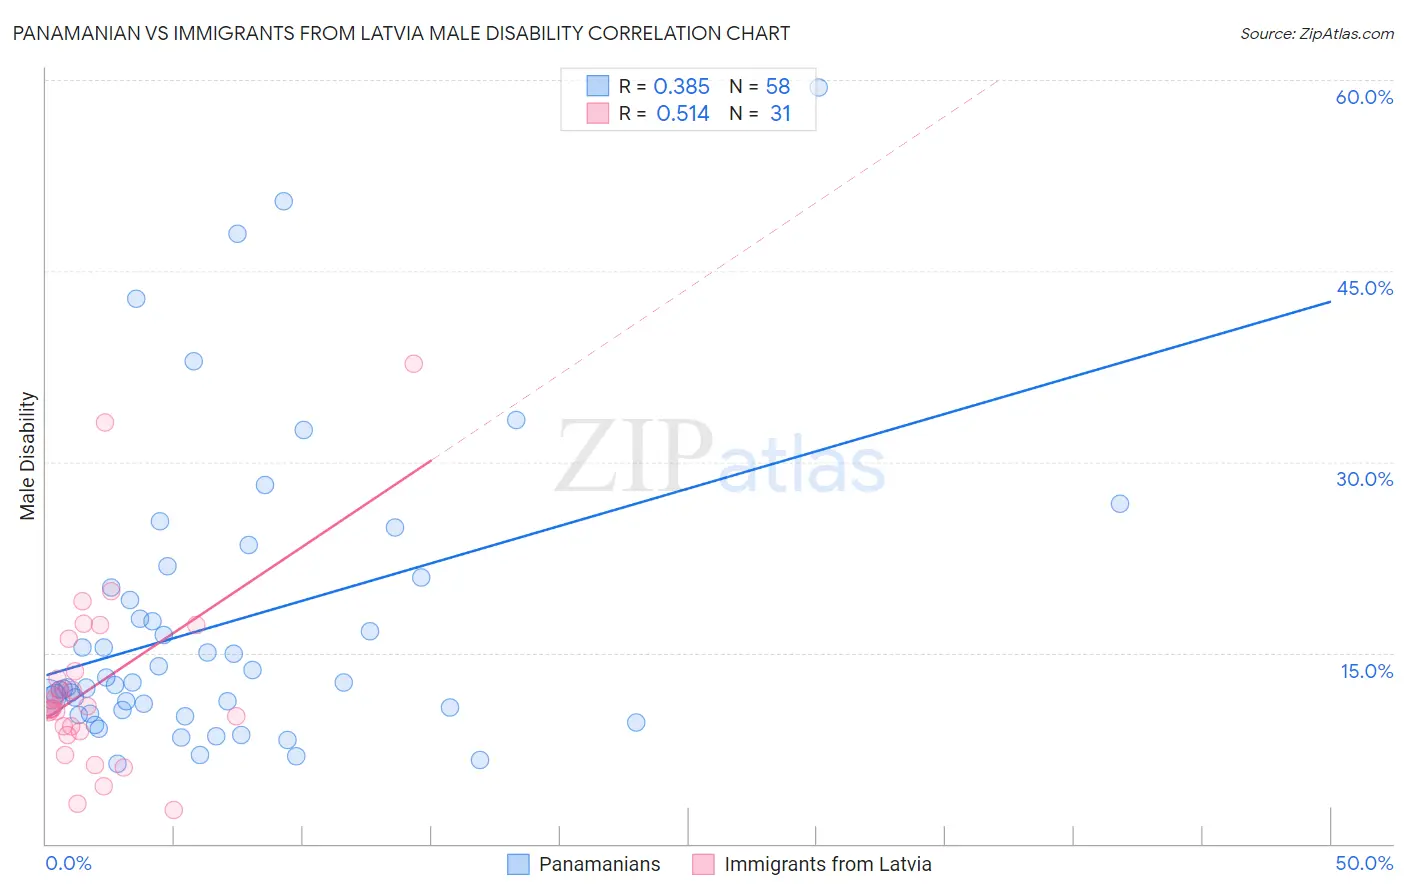
Panamanian vs Immigrants from Latvia Male Disability Correlation Chart
The statistical analysis conducted on geographies consisting of 281,191,975 people shows a mild positive correlation between the proportion of Panamanians and percentage of males with a disability in the United States with a correlation coefficient (R) of 0.385 and weighted average of 11.7%. Similarly, the statistical analysis conducted on geographies consisting of 113,739,259 people shows a substantial positive correlation between the proportion of Immigrants from Latvia and percentage of males with a disability in the United States with a correlation coefficient (R) of 0.514 and weighted average of 10.9%, a difference of 7.1%.
Male Disability Correlation Summary
| Measurement | Panamanian | Immigrants from Latvia |
| Minimum | 6.3% | 2.7% |
| Maximum | 59.5% | 37.7% |
| Range | 53.2% | 35.1% |
| Mean | 17.3% | 12.6% |
| Median | 12.6% | 10.8% |
| Interquartile 25% (IQ1) | 10.5% | 8.9% |
| Interquartile 75% (IQ3) | 20.1% | 16.1% |
| Interquartile Range (IQR) | 9.6% | 7.2% |
| Standard Deviation (Sample) | 11.5% | 7.5% |
| Standard Deviation (Population) | 11.4% | 7.4% |
Similar Demographics by Male Disability
Demographics Similar to Panamanians by Male Disability
In terms of male disability, the demographic groups most similar to Panamanians are Immigrants from Western Europe (11.7%, a difference of 0.010%), Immigrants from Congo (11.7%, a difference of 0.020%), Immigrants from England (11.7%, a difference of 0.060%), Alsatian (11.7%, a difference of 0.17%), and Immigrants from Bahamas (11.7%, a difference of 0.26%).
| Demographics | Rating | Rank | Male Disability |
| Immigrants | Scotland | 8.2 /100 | #212 | Tragic 11.6% |
| Mexican American Indians | 7.8 /100 | #213 | Tragic 11.6% |
| Lithuanians | 6.6 /100 | #214 | Tragic 11.6% |
| Indonesians | 5.9 /100 | #215 | Tragic 11.6% |
| Immigrants | Dominican Republic | 4.9 /100 | #216 | Tragic 11.7% |
| Immigrants | Dominica | 4.6 /100 | #217 | Tragic 11.7% |
| Immigrants | England | 4.0 /100 | #218 | Tragic 11.7% |
| Panamanians | 3.8 /100 | #219 | Tragic 11.7% |
| Immigrants | Western Europe | 3.8 /100 | #220 | Tragic 11.7% |
| Immigrants | Congo | 3.7 /100 | #221 | Tragic 11.7% |
| Alsatians | 3.3 /100 | #222 | Tragic 11.7% |
| Immigrants | Bahamas | 3.2 /100 | #223 | Tragic 11.7% |
| Japanese | 3.1 /100 | #224 | Tragic 11.7% |
| Liberians | 3.1 /100 | #225 | Tragic 11.8% |
| Sub-Saharan Africans | 2.8 /100 | #226 | Tragic 11.8% |
Demographics Similar to Immigrants from Latvia by Male Disability
In terms of male disability, the demographic groups most similar to Immigrants from Latvia are Immigrants from Philippines (10.9%, a difference of 0.0%), Brazilian (10.9%, a difference of 0.0%), Macedonian (11.0%, a difference of 0.14%), Immigrants from Ukraine (10.9%, a difference of 0.16%), and Immigrants from Fiji (11.0%, a difference of 0.16%).
| Demographics | Rating | Rank | Male Disability |
| Immigrants | South Eastern Asia | 89.2 /100 | #121 | Excellent 10.9% |
| Immigrants | Ghana | 89.0 /100 | #122 | Excellent 10.9% |
| Immigrants | Czechoslovakia | 88.4 /100 | #123 | Excellent 10.9% |
| South American Indians | 88.1 /100 | #124 | Excellent 10.9% |
| Immigrants | North Macedonia | 88.1 /100 | #125 | Excellent 10.9% |
| Immigrants | Trinidad and Tobago | 86.9 /100 | #126 | Excellent 10.9% |
| Immigrants | Ukraine | 86.8 /100 | #127 | Excellent 10.9% |
| Immigrants | Latvia | 85.5 /100 | #128 | Excellent 10.9% |
| Immigrants | Philippines | 85.4 /100 | #129 | Excellent 10.9% |
| Brazilians | 85.4 /100 | #130 | Excellent 10.9% |
| Macedonians | 84.2 /100 | #131 | Excellent 11.0% |
| Immigrants | Fiji | 84.0 /100 | #132 | Excellent 11.0% |
| Ugandans | 83.9 /100 | #133 | Excellent 11.0% |
| Bhutanese | 83.4 /100 | #134 | Excellent 11.0% |
| Trinidadians and Tobagonians | 83.3 /100 | #135 | Excellent 11.0% |