Immigrants from Russia vs Immigrants from Latvia Male Disability
COMPARE
Immigrants from Russia
Immigrants from Latvia
Male Disability
Male Disability Comparison
Immigrants from Russia
Immigrants from Latvia
10.6%
MALE DISABILITY
98.6/ 100
METRIC RATING
78th/ 347
METRIC RANK
10.9%
MALE DISABILITY
85.5/ 100
METRIC RATING
128th/ 347
METRIC RANK
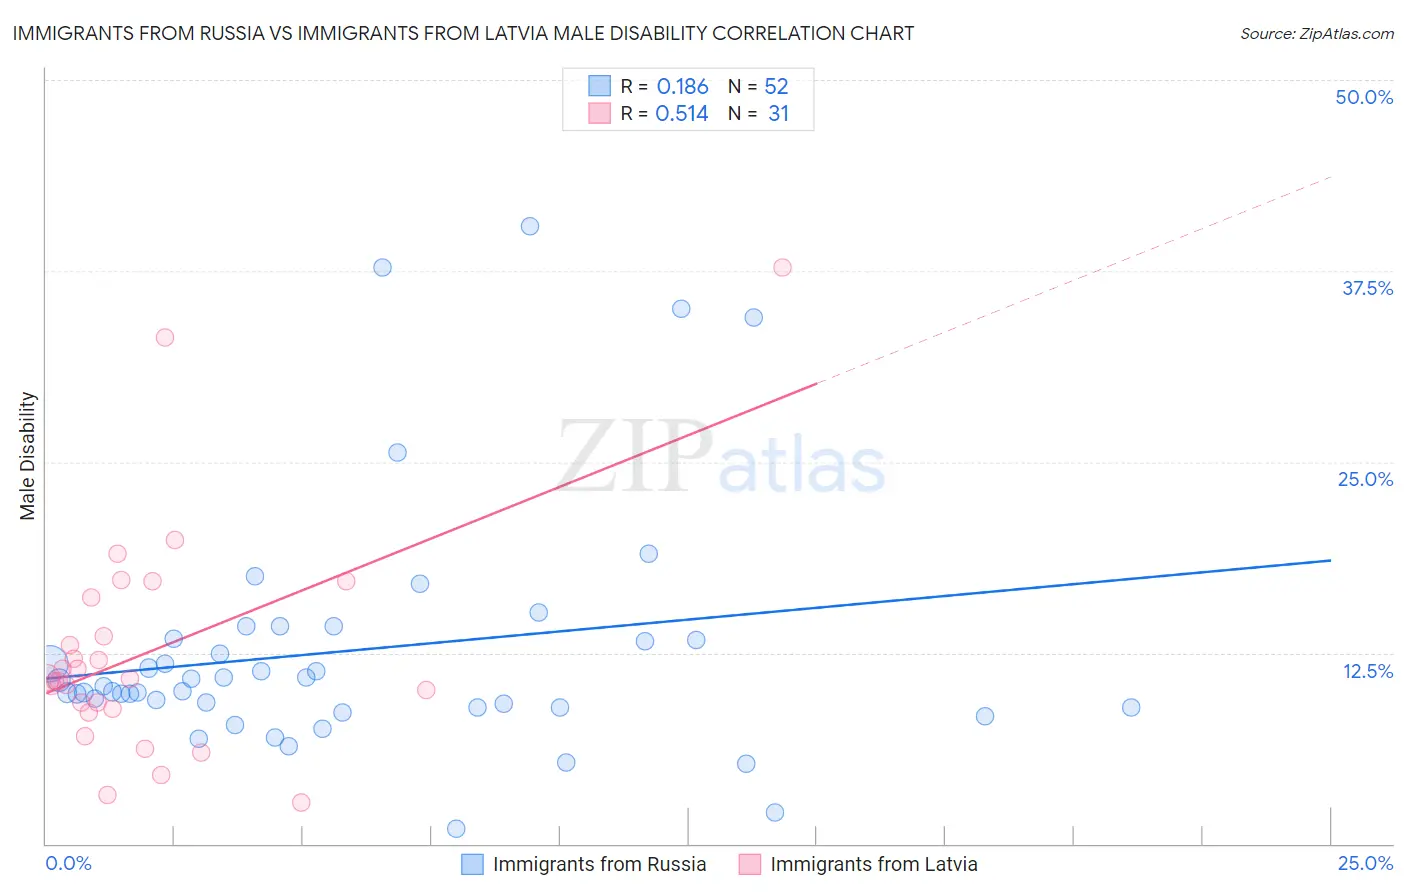
Immigrants from Russia vs Immigrants from Latvia Male Disability Correlation Chart
The statistical analysis conducted on geographies consisting of 347,901,203 people shows a poor positive correlation between the proportion of Immigrants from Russia and percentage of males with a disability in the United States with a correlation coefficient (R) of 0.186 and weighted average of 10.6%. Similarly, the statistical analysis conducted on geographies consisting of 113,739,259 people shows a substantial positive correlation between the proportion of Immigrants from Latvia and percentage of males with a disability in the United States with a correlation coefficient (R) of 0.514 and weighted average of 10.9%, a difference of 3.7%.
Male Disability Correlation Summary
| Measurement | Immigrants from Russia | Immigrants from Latvia |
| Minimum | 0.96% | 2.7% |
| Maximum | 40.4% | 37.7% |
| Range | 39.4% | 35.1% |
| Mean | 12.6% | 12.6% |
| Median | 10.2% | 10.8% |
| Interquartile 25% (IQ1) | 9.0% | 8.9% |
| Interquartile 75% (IQ3) | 13.4% | 16.1% |
| Interquartile Range (IQR) | 4.4% | 7.2% |
| Standard Deviation (Sample) | 8.1% | 7.5% |
| Standard Deviation (Population) | 8.0% | 7.4% |
Similar Demographics by Male Disability
Demographics Similar to Immigrants from Russia by Male Disability
In terms of male disability, the demographic groups most similar to Immigrants from Russia are Laotian (10.6%, a difference of 0.020%), Immigrants from Sierra Leone (10.5%, a difference of 0.080%), Sierra Leonean (10.5%, a difference of 0.12%), Zimbabwean (10.6%, a difference of 0.23%), and Immigrants from Lebanon (10.5%, a difference of 0.24%).
| Demographics | Rating | Rank | Male Disability |
| Immigrants | Cameroon | 99.0 /100 | #71 | Exceptional 10.5% |
| Immigrants | Serbia | 99.0 /100 | #72 | Exceptional 10.5% |
| Immigrants | Lithuania | 98.9 /100 | #73 | Exceptional 10.5% |
| Immigrants | Lebanon | 98.8 /100 | #74 | Exceptional 10.5% |
| Sierra Leoneans | 98.7 /100 | #75 | Exceptional 10.5% |
| Immigrants | Sierra Leone | 98.7 /100 | #76 | Exceptional 10.5% |
| Laotians | 98.6 /100 | #77 | Exceptional 10.6% |
| Immigrants | Russia | 98.6 /100 | #78 | Exceptional 10.6% |
| Zimbabweans | 98.4 /100 | #79 | Exceptional 10.6% |
| Immigrants | Jordan | 98.4 /100 | #80 | Exceptional 10.6% |
| Immigrants | Chile | 98.3 /100 | #81 | Exceptional 10.6% |
| Immigrants | Guyana | 98.2 /100 | #82 | Exceptional 10.6% |
| Immigrants | Poland | 98.1 /100 | #83 | Exceptional 10.6% |
| Bulgarians | 98.1 /100 | #84 | Exceptional 10.6% |
| Sri Lankans | 97.9 /100 | #85 | Exceptional 10.6% |
Demographics Similar to Immigrants from Latvia by Male Disability
In terms of male disability, the demographic groups most similar to Immigrants from Latvia are Immigrants from Philippines (10.9%, a difference of 0.0%), Brazilian (10.9%, a difference of 0.0%), Macedonian (11.0%, a difference of 0.14%), Immigrants from Ukraine (10.9%, a difference of 0.16%), and Immigrants from Fiji (11.0%, a difference of 0.16%).
| Demographics | Rating | Rank | Male Disability |
| Immigrants | South Eastern Asia | 89.2 /100 | #121 | Excellent 10.9% |
| Immigrants | Ghana | 89.0 /100 | #122 | Excellent 10.9% |
| Immigrants | Czechoslovakia | 88.4 /100 | #123 | Excellent 10.9% |
| South American Indians | 88.1 /100 | #124 | Excellent 10.9% |
| Immigrants | North Macedonia | 88.1 /100 | #125 | Excellent 10.9% |
| Immigrants | Trinidad and Tobago | 86.9 /100 | #126 | Excellent 10.9% |
| Immigrants | Ukraine | 86.8 /100 | #127 | Excellent 10.9% |
| Immigrants | Latvia | 85.5 /100 | #128 | Excellent 10.9% |
| Immigrants | Philippines | 85.4 /100 | #129 | Excellent 10.9% |
| Brazilians | 85.4 /100 | #130 | Excellent 10.9% |
| Macedonians | 84.2 /100 | #131 | Excellent 11.0% |
| Immigrants | Fiji | 84.0 /100 | #132 | Excellent 11.0% |
| Ugandans | 83.9 /100 | #133 | Excellent 11.0% |
| Bhutanese | 83.4 /100 | #134 | Excellent 11.0% |
| Trinidadians and Tobagonians | 83.3 /100 | #135 | Excellent 11.0% |