Haitian vs Yugoslavian Disability
COMPARE
Haitian
Yugoslavian
Disability
Disability Comparison
Haitians
Yugoslavians
11.7%
DISABILITY
48.6/ 100
METRIC RATING
175th/ 347
METRIC RANK
12.2%
DISABILITY
1.7/ 100
METRIC RATING
241st/ 347
METRIC RANK
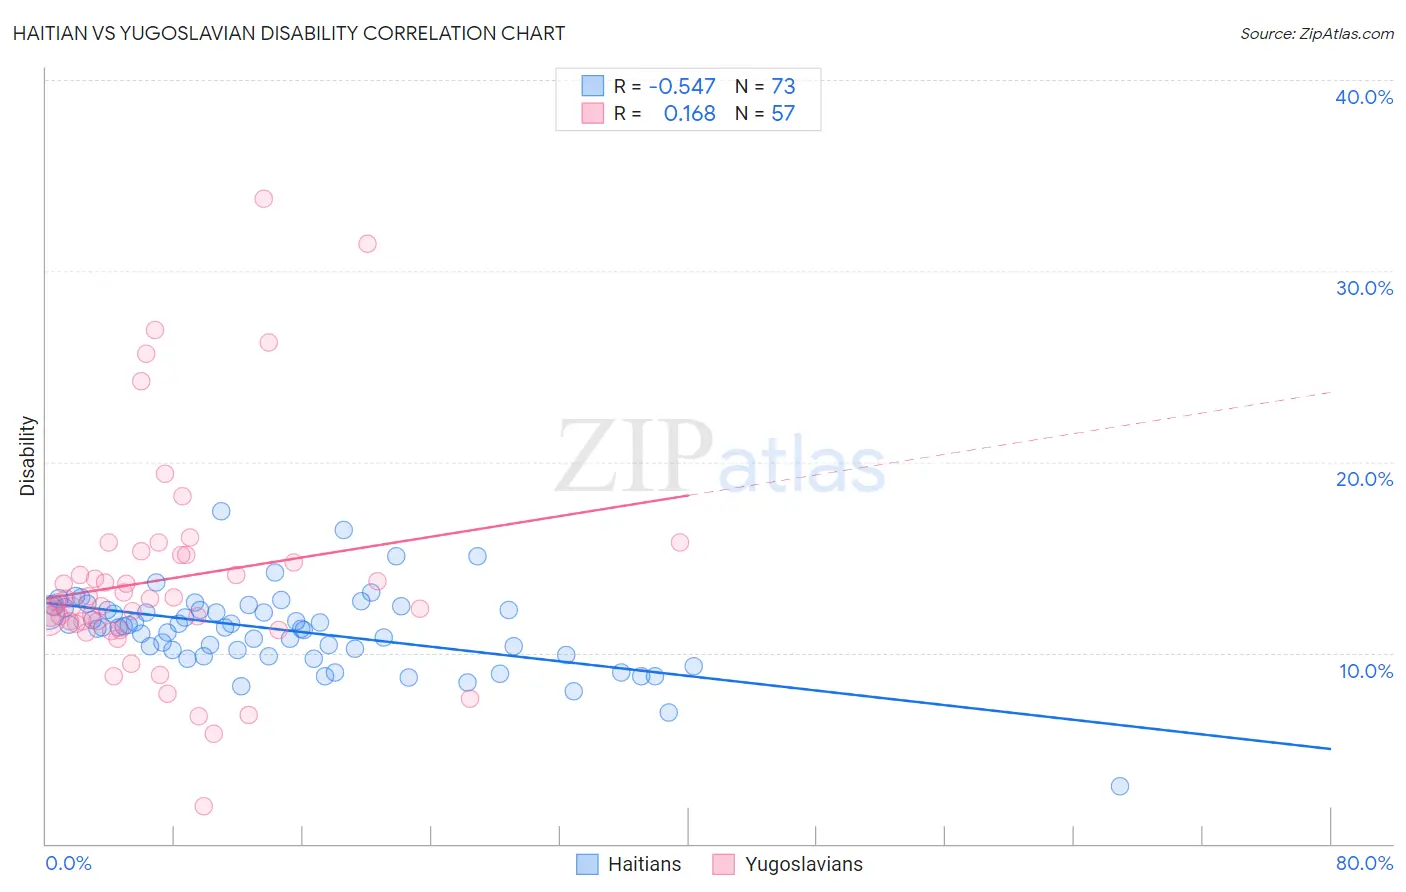
Haitian vs Yugoslavian Disability Correlation Chart
The statistical analysis conducted on geographies consisting of 287,941,476 people shows a substantial negative correlation between the proportion of Haitians and percentage of population with a disability in the United States with a correlation coefficient (R) of -0.547 and weighted average of 11.7%. Similarly, the statistical analysis conducted on geographies consisting of 285,695,841 people shows a poor positive correlation between the proportion of Yugoslavians and percentage of population with a disability in the United States with a correlation coefficient (R) of 0.168 and weighted average of 12.2%, a difference of 4.4%.
Disability Correlation Summary
| Measurement | Haitian | Yugoslavian |
| Minimum | 3.0% | 2.0% |
| Maximum | 17.4% | 33.8% |
| Range | 14.4% | 31.8% |
| Mean | 11.2% | 13.9% |
| Median | 11.3% | 12.6% |
| Interquartile 25% (IQ1) | 10.0% | 11.4% |
| Interquartile 75% (IQ3) | 12.3% | 15.1% |
| Interquartile Range (IQR) | 2.3% | 3.8% |
| Standard Deviation (Sample) | 2.1% | 5.8% |
| Standard Deviation (Population) | 2.1% | 5.8% |
Similar Demographics by Disability
Demographics Similar to Haitians by Disability
In terms of disability, the demographic groups most similar to Haitians are Immigrants from Western Africa (11.7%, a difference of 0.050%), Albanian (11.7%, a difference of 0.060%), Maltese (11.7%, a difference of 0.090%), Immigrants from Central America (11.7%, a difference of 0.090%), and Greek (11.7%, a difference of 0.11%).
| Demographics | Rating | Rank | Disability |
| Immigrants | Latin America | 54.1 /100 | #168 | Average 11.7% |
| Immigrants | Austria | 53.4 /100 | #169 | Average 11.7% |
| Immigrants | Albania | 52.8 /100 | #170 | Average 11.7% |
| Immigrants | Southern Europe | 52.8 /100 | #171 | Average 11.7% |
| Trinidadians and Tobagonians | 52.7 /100 | #172 | Average 11.7% |
| Maltese | 50.6 /100 | #173 | Average 11.7% |
| Albanians | 50.0 /100 | #174 | Average 11.7% |
| Haitians | 48.6 /100 | #175 | Average 11.7% |
| Immigrants | Western Africa | 47.5 /100 | #176 | Average 11.7% |
| Immigrants | Central America | 46.6 /100 | #177 | Average 11.7% |
| Greeks | 46.2 /100 | #178 | Average 11.7% |
| Immigrants | Armenia | 41.9 /100 | #179 | Average 11.7% |
| Immigrants | Honduras | 37.8 /100 | #180 | Fair 11.8% |
| Immigrants | Oceania | 34.3 /100 | #181 | Fair 11.8% |
| Icelanders | 34.0 /100 | #182 | Fair 11.8% |
Demographics Similar to Yugoslavians by Disability
In terms of disability, the demographic groups most similar to Yugoslavians are Hungarian (12.2%, a difference of 0.0%), Polish (12.2%, a difference of 0.020%), Swedish (12.2%, a difference of 0.050%), Norwegian (12.2%, a difference of 0.090%), and British (12.2%, a difference of 0.11%).
| Demographics | Rating | Rank | Disability |
| Japanese | 2.3 /100 | #234 | Tragic 12.2% |
| Yup'ik | 2.2 /100 | #235 | Tragic 12.2% |
| Chinese | 2.0 /100 | #236 | Tragic 12.2% |
| Immigrants | Congo | 1.9 /100 | #237 | Tragic 12.2% |
| Norwegians | 1.9 /100 | #238 | Tragic 12.2% |
| Swedes | 1.8 /100 | #239 | Tragic 12.2% |
| Hungarians | 1.7 /100 | #240 | Tragic 12.2% |
| Yugoslavians | 1.7 /100 | #241 | Tragic 12.2% |
| Poles | 1.7 /100 | #242 | Tragic 12.2% |
| British | 1.5 /100 | #243 | Tragic 12.2% |
| Basques | 1.5 /100 | #244 | Tragic 12.2% |
| Liberians | 1.5 /100 | #245 | Tragic 12.2% |
| Swiss | 1.5 /100 | #246 | Tragic 12.2% |
| Indonesians | 1.4 /100 | #247 | Tragic 12.2% |
| Guamanians/Chamorros | 1.4 /100 | #248 | Tragic 12.3% |