Alsatian vs Venezuelan Disability
COMPARE
Alsatian
Venezuelan
Disability
Disability Comparison
Alsatians
Venezuelans
12.1%
DISABILITY
3.3/ 100
METRIC RATING
227th/ 347
METRIC RANK
10.5%
DISABILITY
100.0/ 100
METRIC RATING
24th/ 347
METRIC RANK
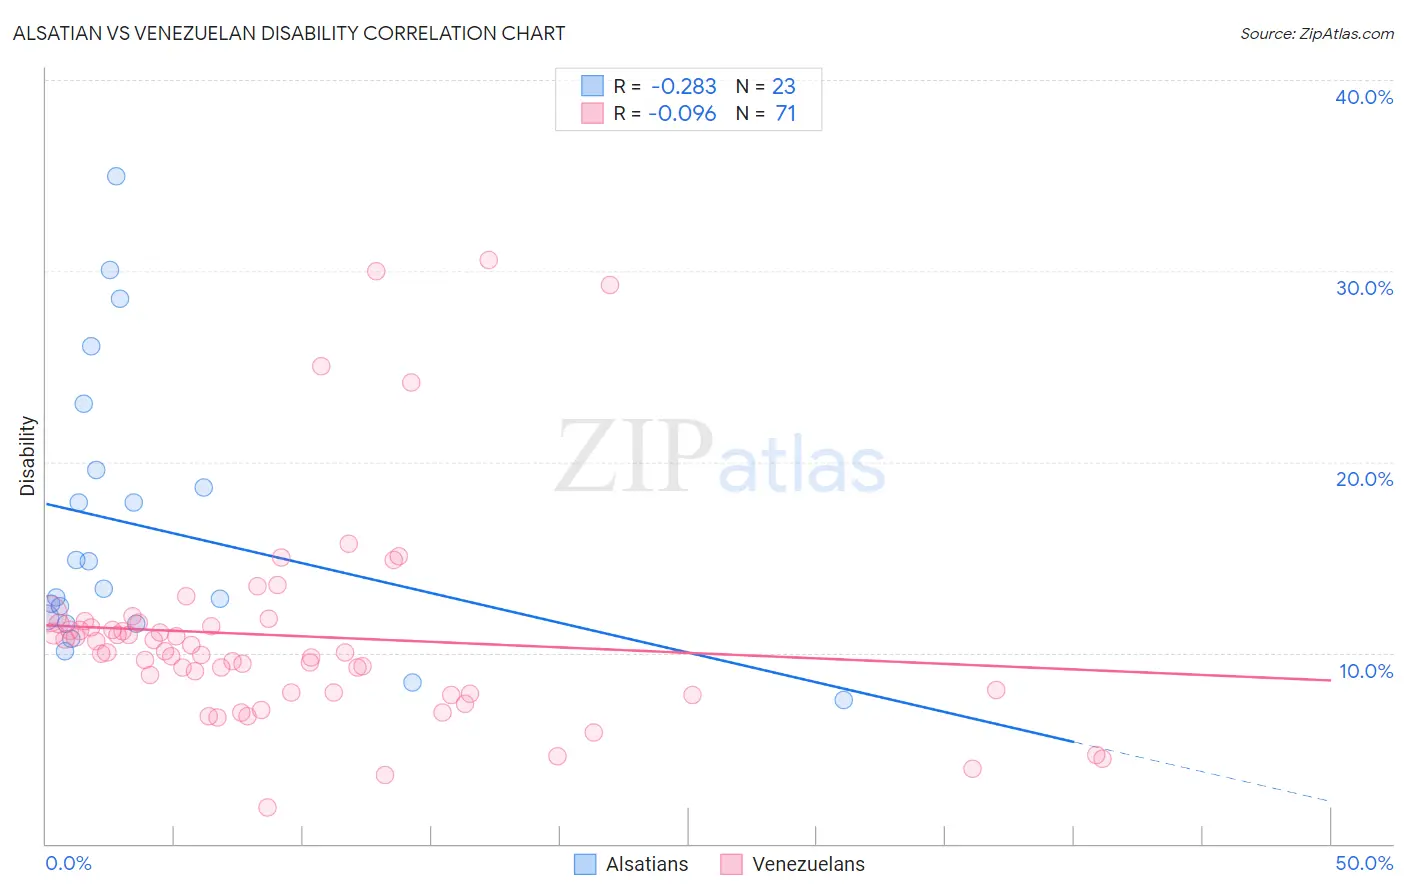
Alsatian vs Venezuelan Disability Correlation Chart
The statistical analysis conducted on geographies consisting of 82,681,540 people shows a weak negative correlation between the proportion of Alsatians and percentage of population with a disability in the United States with a correlation coefficient (R) of -0.283 and weighted average of 12.1%. Similarly, the statistical analysis conducted on geographies consisting of 306,306,571 people shows a slight negative correlation between the proportion of Venezuelans and percentage of population with a disability in the United States with a correlation coefficient (R) of -0.096 and weighted average of 10.5%, a difference of 15.1%.
Disability Correlation Summary
| Measurement | Alsatian | Venezuelan |
| Minimum | 7.5% | 1.9% |
| Maximum | 34.9% | 30.5% |
| Range | 27.4% | 28.6% |
| Mean | 16.6% | 10.9% |
| Median | 13.4% | 10.0% |
| Interquartile 25% (IQ1) | 11.5% | 7.9% |
| Interquartile 75% (IQ3) | 19.6% | 11.5% |
| Interquartile Range (IQR) | 8.0% | 3.6% |
| Standard Deviation (Sample) | 7.3% | 5.5% |
| Standard Deviation (Population) | 7.2% | 5.4% |
Similar Demographics by Disability
Demographics Similar to Alsatians by Disability
In terms of disability, the demographic groups most similar to Alsatians are Jamaican (12.1%, a difference of 0.010%), Senegalese (12.1%, a difference of 0.060%), Mexican (12.1%, a difference of 0.14%), West Indian (12.2%, a difference of 0.14%), and Inupiat (12.2%, a difference of 0.16%).
| Demographics | Rating | Rank | Disability |
| Immigrants | Bahamas | 4.7 /100 | #220 | Tragic 12.1% |
| Northern Europeans | 4.2 /100 | #221 | Tragic 12.1% |
| Spanish American Indians | 4.1 /100 | #222 | Tragic 12.1% |
| Hispanics or Latinos | 3.9 /100 | #223 | Tragic 12.1% |
| Mexicans | 3.7 /100 | #224 | Tragic 12.1% |
| Senegalese | 3.5 /100 | #225 | Tragic 12.1% |
| Jamaicans | 3.3 /100 | #226 | Tragic 12.1% |
| Alsatians | 3.3 /100 | #227 | Tragic 12.1% |
| West Indians | 2.9 /100 | #228 | Tragic 12.2% |
| Inupiat | 2.8 /100 | #229 | Tragic 12.2% |
| Samoans | 2.6 /100 | #230 | Tragic 12.2% |
| Malaysians | 2.5 /100 | #231 | Tragic 12.2% |
| Italians | 2.5 /100 | #232 | Tragic 12.2% |
| Bahamians | 2.3 /100 | #233 | Tragic 12.2% |
| Japanese | 2.3 /100 | #234 | Tragic 12.2% |
Demographics Similar to Venezuelans by Disability
In terms of disability, the demographic groups most similar to Venezuelans are Immigrants from Asia (10.5%, a difference of 0.14%), Immigrants from Malaysia (10.6%, a difference of 0.38%), Argentinean (10.6%, a difference of 0.43%), Cypriot (10.6%, a difference of 0.44%), and Egyptian (10.6%, a difference of 0.57%).
| Demographics | Rating | Rank | Disability |
| Immigrants | Iran | 100.0 /100 | #17 | Exceptional 10.3% |
| Burmese | 100.0 /100 | #18 | Exceptional 10.4% |
| Immigrants | Pakistan | 100.0 /100 | #19 | Exceptional 10.4% |
| Immigrants | Venezuela | 100.0 /100 | #20 | Exceptional 10.4% |
| Asians | 100.0 /100 | #21 | Exceptional 10.4% |
| Immigrants | Sri Lanka | 100.0 /100 | #22 | Exceptional 10.5% |
| Immigrants | Asia | 100.0 /100 | #23 | Exceptional 10.5% |
| Venezuelans | 100.0 /100 | #24 | Exceptional 10.5% |
| Immigrants | Malaysia | 100.0 /100 | #25 | Exceptional 10.6% |
| Argentineans | 100.0 /100 | #26 | Exceptional 10.6% |
| Cypriots | 100.0 /100 | #27 | Exceptional 10.6% |
| Egyptians | 100.0 /100 | #28 | Exceptional 10.6% |
| Immigrants | Argentina | 100.0 /100 | #29 | Exceptional 10.6% |
| Immigrants | Turkey | 100.0 /100 | #30 | Exceptional 10.6% |
| Immigrants | Egypt | 100.0 /100 | #31 | Exceptional 10.6% |