Immigrants from Congo vs Venezuelan GED/Equivalency
COMPARE
Immigrants from Congo
Venezuelan
GED/Equivalency
GED/Equivalency Comparison
Immigrants from Congo
Venezuelans
83.1%
GED/EQUIVALENCY
0.2/ 100
METRIC RATING
263rd/ 347
METRIC RANK
86.0%
GED/EQUIVALENCY
65.5/ 100
METRIC RATING
164th/ 347
METRIC RANK
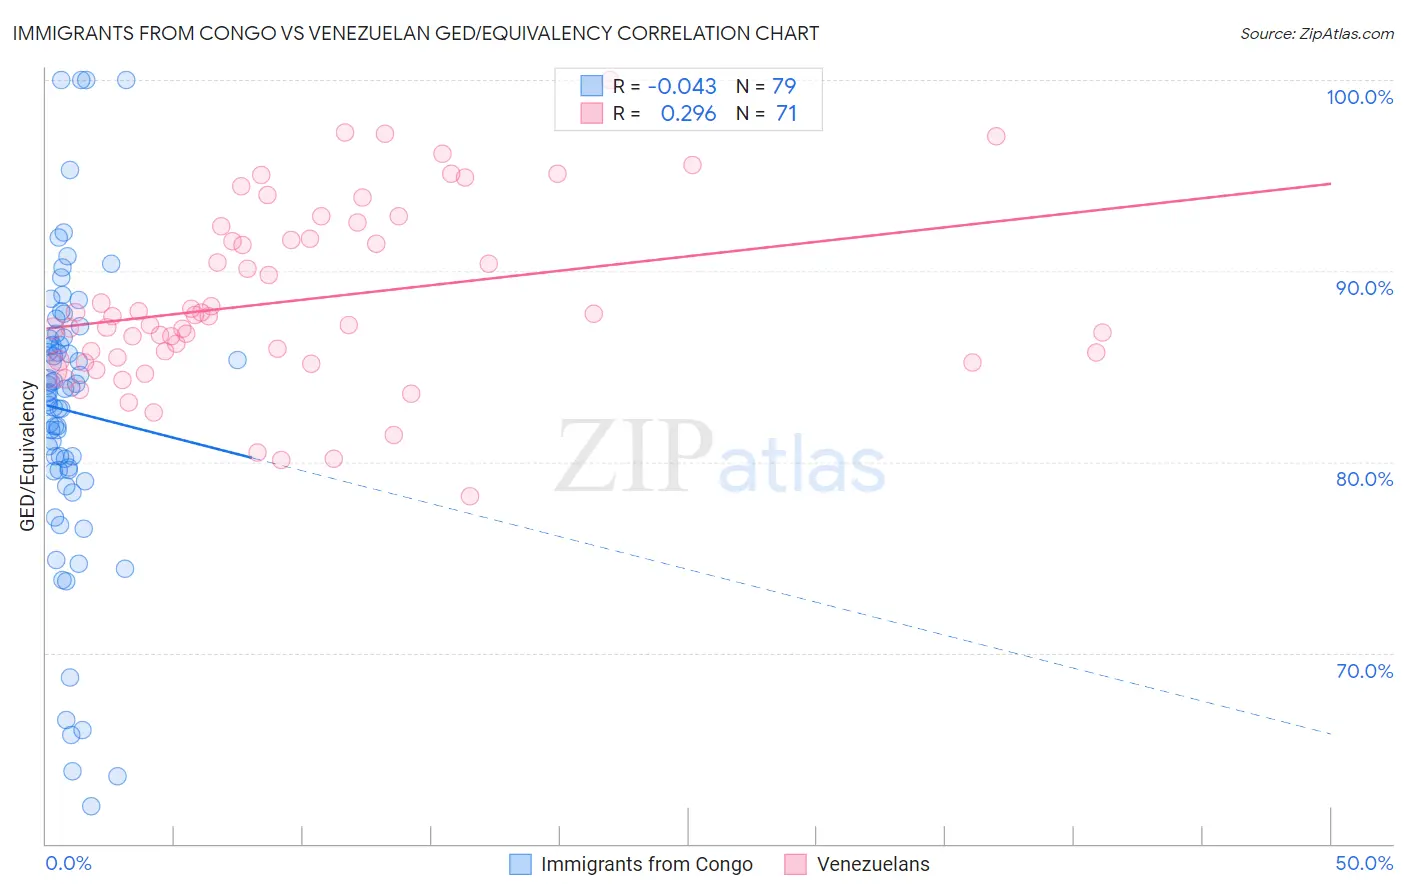
Immigrants from Congo vs Venezuelan GED/Equivalency Correlation Chart
The statistical analysis conducted on geographies consisting of 92,095,910 people shows no correlation between the proportion of Immigrants from Congo and percentage of population with at least ged/equivalency education in the United States with a correlation coefficient (R) of -0.043 and weighted average of 83.1%. Similarly, the statistical analysis conducted on geographies consisting of 306,323,638 people shows a weak positive correlation between the proportion of Venezuelans and percentage of population with at least ged/equivalency education in the United States with a correlation coefficient (R) of 0.296 and weighted average of 86.0%, a difference of 3.6%.
GED/Equivalency Correlation Summary
| Measurement | Immigrants from Congo | Venezuelan |
| Minimum | 62.0% | 78.2% |
| Maximum | 100.0% | 100.0% |
| Range | 38.0% | 21.8% |
| Mean | 82.7% | 88.5% |
| Median | 83.7% | 87.6% |
| Interquartile 25% (IQ1) | 79.5% | 85.3% |
| Interquartile 75% (IQ3) | 86.5% | 91.7% |
| Interquartile Range (IQR) | 7.0% | 6.4% |
| Standard Deviation (Sample) | 7.9% | 4.7% |
| Standard Deviation (Population) | 7.8% | 4.6% |
Similar Demographics by GED/Equivalency
Demographics Similar to Immigrants from Congo by GED/Equivalency
In terms of ged/equivalency, the demographic groups most similar to Immigrants from Congo are Inupiat (83.1%, a difference of 0.010%), Immigrants from Armenia (83.1%, a difference of 0.010%), Bangladeshi (83.1%, a difference of 0.010%), West Indian (83.1%, a difference of 0.020%), and Kiowa (83.1%, a difference of 0.030%).
| Demographics | Rating | Rank | GED/Equivalency |
| Africans | 0.5 /100 | #256 | Tragic 83.4% |
| Jamaicans | 0.4 /100 | #257 | Tragic 83.3% |
| Malaysians | 0.4 /100 | #258 | Tragic 83.3% |
| Immigrants | Vietnam | 0.3 /100 | #259 | Tragic 83.2% |
| Choctaw | 0.3 /100 | #260 | Tragic 83.1% |
| Inupiat | 0.2 /100 | #261 | Tragic 83.1% |
| Immigrants | Armenia | 0.2 /100 | #262 | Tragic 83.1% |
| Immigrants | Congo | 0.2 /100 | #263 | Tragic 83.1% |
| Bangladeshis | 0.2 /100 | #264 | Tragic 83.1% |
| West Indians | 0.2 /100 | #265 | Tragic 83.1% |
| Kiowa | 0.2 /100 | #266 | Tragic 83.1% |
| Trinidadians and Tobagonians | 0.2 /100 | #267 | Tragic 83.0% |
| Immigrants | Burma/Myanmar | 0.2 /100 | #268 | Tragic 83.0% |
| Hopi | 0.2 /100 | #269 | Tragic 83.0% |
| Immigrants | Jamaica | 0.2 /100 | #270 | Tragic 82.9% |
Demographics Similar to Venezuelans by GED/Equivalency
In terms of ged/equivalency, the demographic groups most similar to Venezuelans are Ugandan (86.1%, a difference of 0.020%), Alsatian (86.0%, a difference of 0.030%), Immigrants from Albania (86.0%, a difference of 0.030%), Ethiopian (86.0%, a difference of 0.040%), and Immigrants from Iraq (86.1%, a difference of 0.060%).
| Demographics | Rating | Rank | GED/Equivalency |
| Whites/Caucasians | 72.2 /100 | #157 | Good 86.2% |
| German Russians | 72.1 /100 | #158 | Good 86.2% |
| Immigrants | Kenya | 71.8 /100 | #159 | Good 86.2% |
| Immigrants | Morocco | 69.5 /100 | #160 | Good 86.1% |
| Immigrants | Syria | 69.3 /100 | #161 | Good 86.1% |
| Immigrants | Iraq | 68.1 /100 | #162 | Good 86.1% |
| Ugandans | 66.3 /100 | #163 | Good 86.1% |
| Venezuelans | 65.5 /100 | #164 | Good 86.0% |
| Alsatians | 64.3 /100 | #165 | Good 86.0% |
| Immigrants | Albania | 64.2 /100 | #166 | Good 86.0% |
| Ethiopians | 63.7 /100 | #167 | Good 86.0% |
| Sierra Leoneans | 61.8 /100 | #168 | Good 86.0% |
| Immigrants | Ethiopia | 61.2 /100 | #169 | Good 86.0% |
| Afghans | 59.7 /100 | #170 | Average 85.9% |
| Immigrants | Chile | 57.3 /100 | #171 | Average 85.9% |