Immigrants from the Azores vs Guyanese Disability
COMPARE
Immigrants from the Azores
Guyanese
Disability
Disability Comparison
Immigrants from the Azores
Guyanese
14.2%
DISABILITY
0.0/ 100
METRIC RATING
328th/ 347
METRIC RANK
11.3%
DISABILITY
94.7/ 100
METRIC RATING
113th/ 347
METRIC RANK
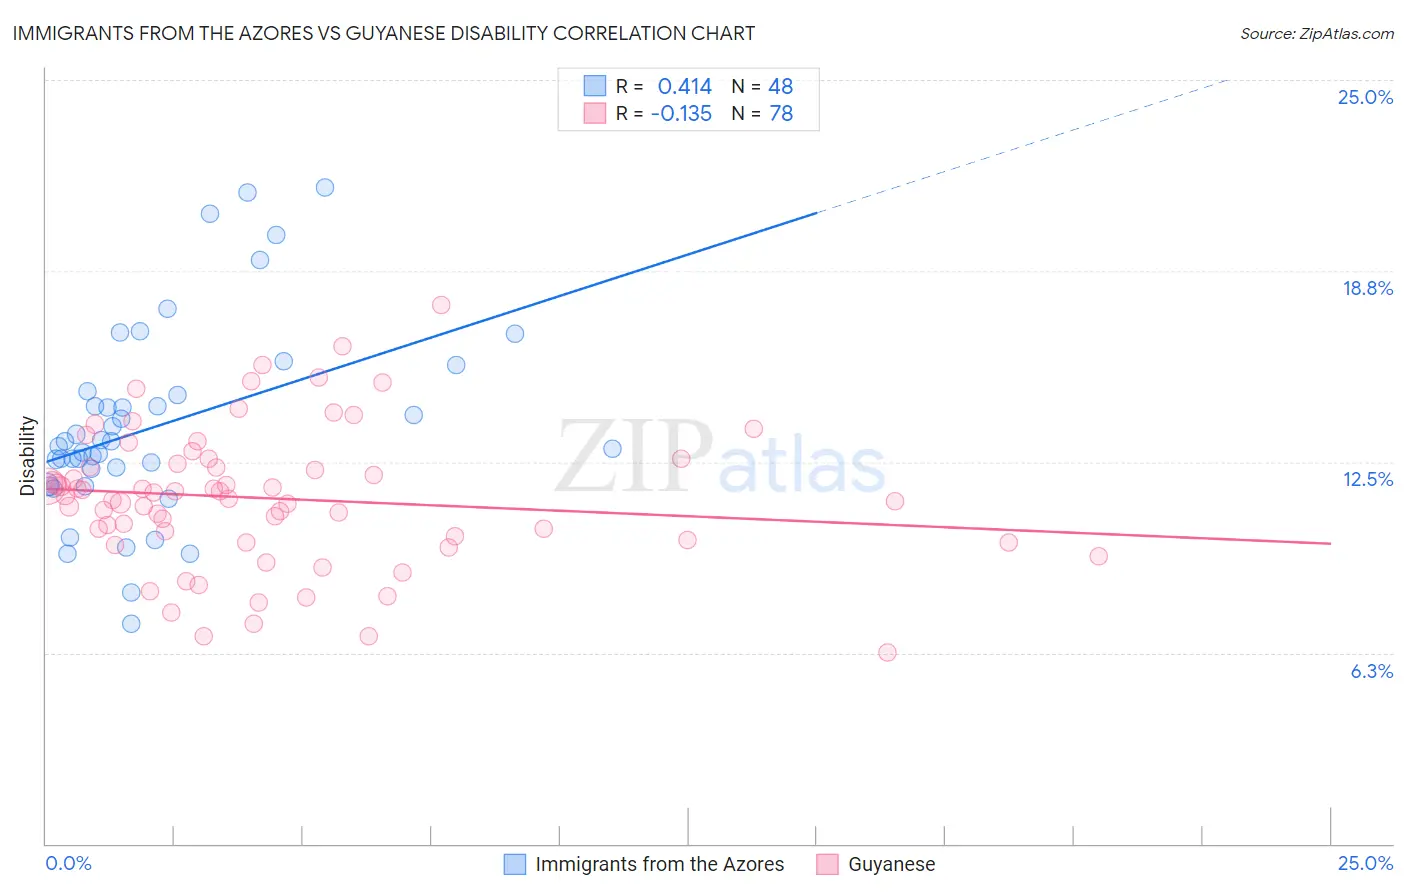
Immigrants from the Azores vs Guyanese Disability Correlation Chart
The statistical analysis conducted on geographies consisting of 46,257,178 people shows a moderate positive correlation between the proportion of Immigrants from the Azores and percentage of population with a disability in the United States with a correlation coefficient (R) of 0.414 and weighted average of 14.2%. Similarly, the statistical analysis conducted on geographies consisting of 176,904,345 people shows a poor negative correlation between the proportion of Guyanese and percentage of population with a disability in the United States with a correlation coefficient (R) of -0.135 and weighted average of 11.3%, a difference of 25.0%.
Disability Correlation Summary
| Measurement | Immigrants from the Azores | Guyanese |
| Minimum | 7.2% | 6.2% |
| Maximum | 21.5% | 17.6% |
| Range | 14.3% | 11.4% |
| Mean | 13.7% | 11.3% |
| Median | 13.1% | 11.3% |
| Interquartile 25% (IQ1) | 12.0% | 9.9% |
| Interquartile 75% (IQ3) | 14.8% | 12.5% |
| Interquartile Range (IQR) | 2.7% | 2.5% |
| Standard Deviation (Sample) | 3.2% | 2.3% |
| Standard Deviation (Population) | 3.1% | 2.3% |
Similar Demographics by Disability
Demographics Similar to Immigrants from the Azores by Disability
In terms of disability, the demographic groups most similar to Immigrants from the Azores are Ottawa (14.2%, a difference of 0.0%), Osage (14.2%, a difference of 0.020%), Native/Alaskan (14.2%, a difference of 0.060%), Chippewa (14.1%, a difference of 0.10%), and Potawatomi (14.2%, a difference of 0.12%).
| Demographics | Rating | Rank | Disability |
| Paiute | 0.0 /100 | #321 | Tragic 13.9% |
| Americans | 0.0 /100 | #322 | Tragic 13.9% |
| Comanche | 0.0 /100 | #323 | Tragic 14.1% |
| Chippewa | 0.0 /100 | #324 | Tragic 14.1% |
| Natives/Alaskans | 0.0 /100 | #325 | Tragic 14.2% |
| Osage | 0.0 /100 | #326 | Tragic 14.2% |
| Ottawa | 0.0 /100 | #327 | Tragic 14.2% |
| Immigrants | Azores | 0.0 /100 | #328 | Tragic 14.2% |
| Potawatomi | 0.0 /100 | #329 | Tragic 14.2% |
| Navajo | 0.0 /100 | #330 | Tragic 14.3% |
| Alaskan Athabascans | 0.0 /100 | #331 | Tragic 14.4% |
| Pueblo | 0.0 /100 | #332 | Tragic 14.4% |
| Cajuns | 0.0 /100 | #333 | Tragic 14.6% |
| Yuman | 0.0 /100 | #334 | Tragic 14.6% |
| Tohono O'odham | 0.0 /100 | #335 | Tragic 14.8% |
Demographics Similar to Guyanese by Disability
In terms of disability, the demographic groups most similar to Guyanese are Immigrants from Syria (11.3%, a difference of 0.010%), Immigrants from Philippines (11.3%, a difference of 0.020%), Immigrants from Uzbekistan (11.3%, a difference of 0.040%), Immigrants from Northern Europe (11.3%, a difference of 0.13%), and Immigrants from South Eastern Asia (11.3%, a difference of 0.16%).
| Demographics | Rating | Rank | Disability |
| Immigrants | Eastern Europe | 96.3 /100 | #106 | Exceptional 11.3% |
| Nicaraguans | 96.2 /100 | #107 | Exceptional 11.3% |
| Immigrants | Nigeria | 96.0 /100 | #108 | Exceptional 11.3% |
| Immigrants | Uganda | 95.7 /100 | #109 | Exceptional 11.3% |
| Immigrants | Denmark | 95.6 /100 | #110 | Exceptional 11.3% |
| Immigrants | South Eastern Asia | 95.4 /100 | #111 | Exceptional 11.3% |
| Immigrants | Uzbekistan | 94.9 /100 | #112 | Exceptional 11.3% |
| Guyanese | 94.7 /100 | #113 | Exceptional 11.3% |
| Immigrants | Syria | 94.7 /100 | #114 | Exceptional 11.3% |
| Immigrants | Philippines | 94.6 /100 | #115 | Exceptional 11.3% |
| Immigrants | Northern Europe | 94.1 /100 | #116 | Exceptional 11.3% |
| Luxembourgers | 93.9 /100 | #117 | Exceptional 11.3% |
| Koreans | 93.8 /100 | #118 | Exceptional 11.3% |
| Central Americans | 93.5 /100 | #119 | Exceptional 11.4% |
| Immigrants | North Macedonia | 93.5 /100 | #120 | Exceptional 11.4% |