Immigrants from Guyana vs Guyanese Disability
COMPARE
Immigrants from Guyana
Guyanese
Disability
Disability Comparison
Immigrants from Guyana
Guyanese
11.4%
DISABILITY
88.3/ 100
METRIC RATING
134th/ 347
METRIC RANK
11.3%
DISABILITY
94.7/ 100
METRIC RATING
113th/ 347
METRIC RANK
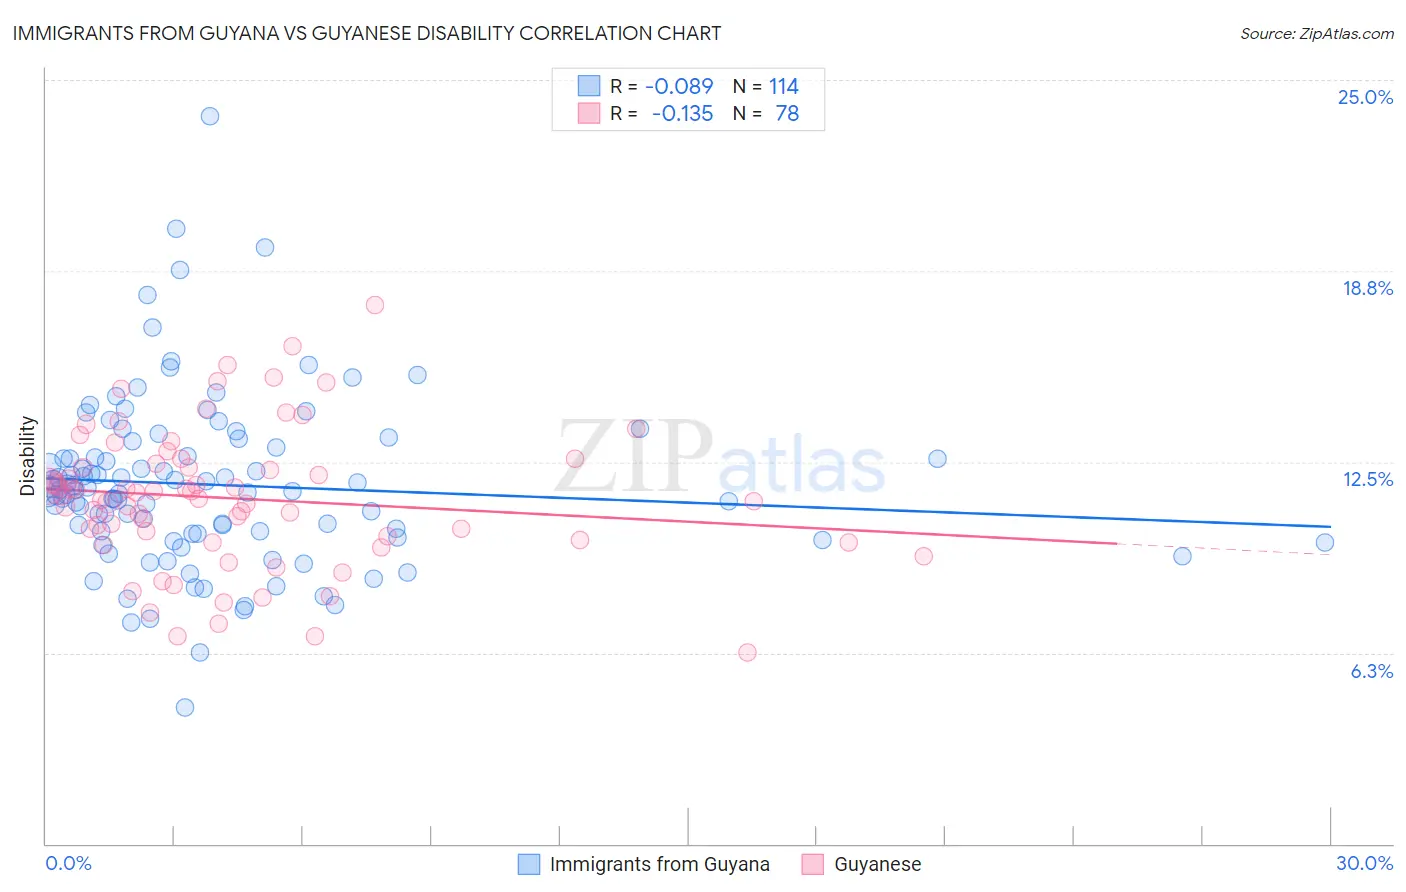
Immigrants from Guyana vs Guyanese Disability Correlation Chart
The statistical analysis conducted on geographies consisting of 183,715,267 people shows a slight negative correlation between the proportion of Immigrants from Guyana and percentage of population with a disability in the United States with a correlation coefficient (R) of -0.089 and weighted average of 11.4%. Similarly, the statistical analysis conducted on geographies consisting of 176,904,345 people shows a poor negative correlation between the proportion of Guyanese and percentage of population with a disability in the United States with a correlation coefficient (R) of -0.135 and weighted average of 11.3%, a difference of 0.99%.
Disability Correlation Summary
| Measurement | Immigrants from Guyana | Guyanese |
| Minimum | 4.4% | 6.2% |
| Maximum | 23.8% | 17.6% |
| Range | 19.4% | 11.4% |
| Mean | 11.8% | 11.3% |
| Median | 11.6% | 11.3% |
| Interquartile 25% (IQ1) | 10.1% | 9.9% |
| Interquartile 75% (IQ3) | 13.0% | 12.5% |
| Interquartile Range (IQR) | 2.8% | 2.5% |
| Standard Deviation (Sample) | 2.8% | 2.3% |
| Standard Deviation (Population) | 2.8% | 2.3% |
Similar Demographics by Disability
Demographics Similar to Immigrants from Guyana by Disability
In terms of disability, the demographic groups most similar to Immigrants from Guyana are Ugandan (11.4%, a difference of 0.050%), Immigrants from St. Vincent and the Grenadines (11.4%, a difference of 0.060%), Arab (11.4%, a difference of 0.080%), Immigrants from Africa (11.4%, a difference of 0.11%), and Kenyan (11.5%, a difference of 0.13%).
| Demographics | Rating | Rank | Disability |
| Immigrants | Italy | 90.4 /100 | #127 | Exceptional 11.4% |
| Immigrants | Europe | 90.4 /100 | #128 | Exceptional 11.4% |
| Macedonians | 90.3 /100 | #129 | Exceptional 11.4% |
| Latvians | 89.8 /100 | #130 | Excellent 11.4% |
| Immigrants | Croatia | 89.8 /100 | #131 | Excellent 11.4% |
| Immigrants | Africa | 89.3 /100 | #132 | Excellent 11.4% |
| Arabs | 89.1 /100 | #133 | Excellent 11.4% |
| Immigrants | Guyana | 88.3 /100 | #134 | Excellent 11.4% |
| Ugandans | 87.9 /100 | #135 | Excellent 11.4% |
| Immigrants | St. Vincent and the Grenadines | 87.8 /100 | #136 | Excellent 11.4% |
| Kenyans | 87.1 /100 | #137 | Excellent 11.5% |
| New Zealanders | 87.0 /100 | #138 | Excellent 11.5% |
| Ghanaians | 87.0 /100 | #139 | Excellent 11.5% |
| Russians | 86.8 /100 | #140 | Excellent 11.5% |
| Immigrants | Grenada | 86.1 /100 | #141 | Excellent 11.5% |
Demographics Similar to Guyanese by Disability
In terms of disability, the demographic groups most similar to Guyanese are Immigrants from Syria (11.3%, a difference of 0.010%), Immigrants from Philippines (11.3%, a difference of 0.020%), Immigrants from Uzbekistan (11.3%, a difference of 0.040%), Immigrants from Northern Europe (11.3%, a difference of 0.13%), and Immigrants from South Eastern Asia (11.3%, a difference of 0.16%).
| Demographics | Rating | Rank | Disability |
| Immigrants | Eastern Europe | 96.3 /100 | #106 | Exceptional 11.3% |
| Nicaraguans | 96.2 /100 | #107 | Exceptional 11.3% |
| Immigrants | Nigeria | 96.0 /100 | #108 | Exceptional 11.3% |
| Immigrants | Uganda | 95.7 /100 | #109 | Exceptional 11.3% |
| Immigrants | Denmark | 95.6 /100 | #110 | Exceptional 11.3% |
| Immigrants | South Eastern Asia | 95.4 /100 | #111 | Exceptional 11.3% |
| Immigrants | Uzbekistan | 94.9 /100 | #112 | Exceptional 11.3% |
| Guyanese | 94.7 /100 | #113 | Exceptional 11.3% |
| Immigrants | Syria | 94.7 /100 | #114 | Exceptional 11.3% |
| Immigrants | Philippines | 94.6 /100 | #115 | Exceptional 11.3% |
| Immigrants | Northern Europe | 94.1 /100 | #116 | Exceptional 11.3% |
| Luxembourgers | 93.9 /100 | #117 | Exceptional 11.3% |
| Koreans | 93.8 /100 | #118 | Exceptional 11.3% |
| Central Americans | 93.5 /100 | #119 | Exceptional 11.4% |
| Immigrants | North Macedonia | 93.5 /100 | #120 | Exceptional 11.4% |