Immigrants from Fiji vs Chilean Disability
COMPARE
Immigrants from Fiji
Chilean
Disability
Disability Comparison
Immigrants from Fiji
Chileans
11.6%
DISABILITY
69.5/ 100
METRIC RATING
156th/ 347
METRIC RANK
11.1%
DISABILITY
99.1/ 100
METRIC RATING
82nd/ 347
METRIC RANK
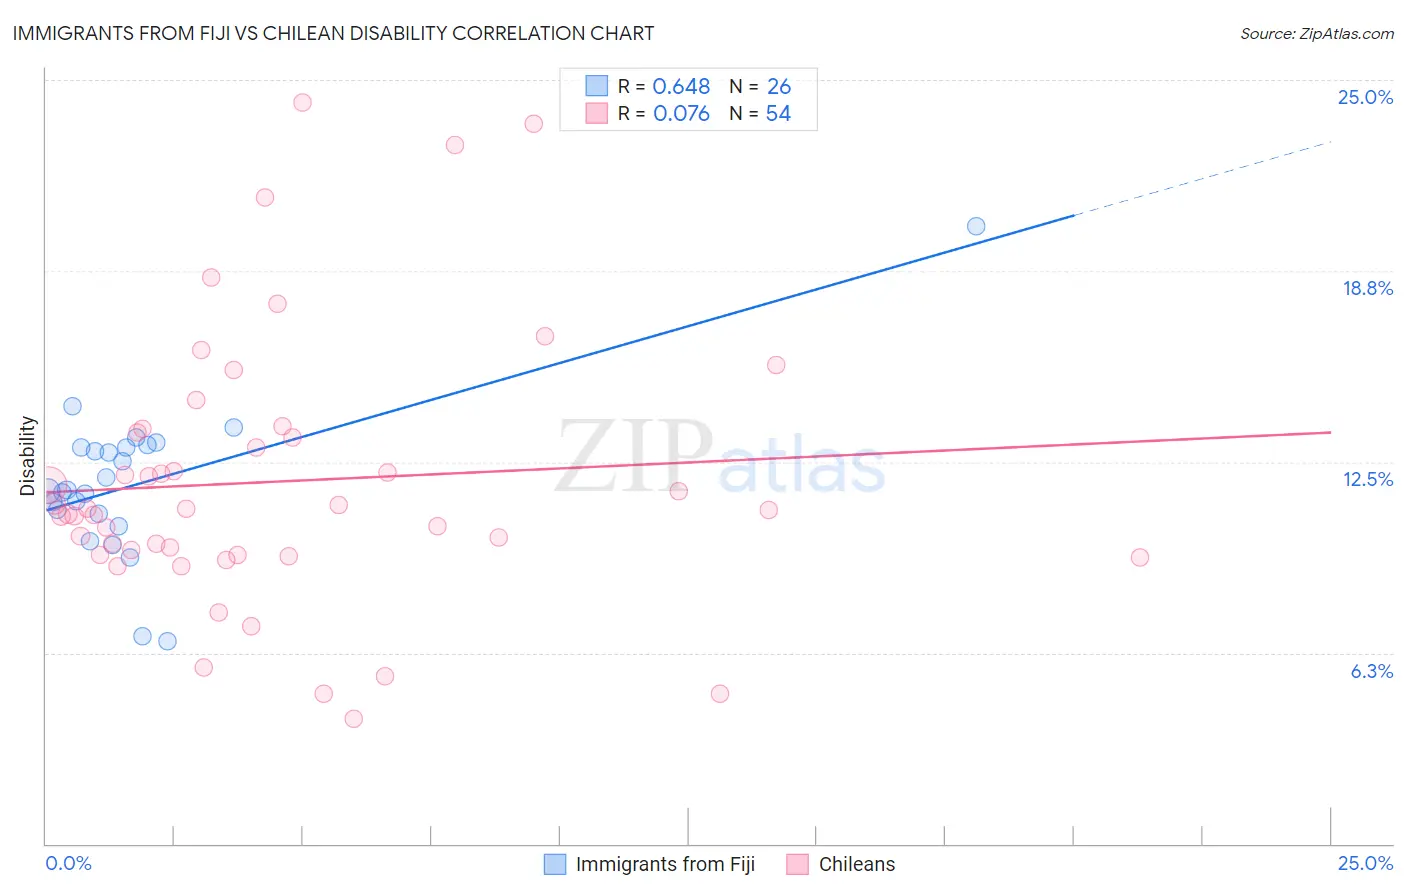
Immigrants from Fiji vs Chilean Disability Correlation Chart
The statistical analysis conducted on geographies consisting of 93,755,847 people shows a significant positive correlation between the proportion of Immigrants from Fiji and percentage of population with a disability in the United States with a correlation coefficient (R) of 0.648 and weighted average of 11.6%. Similarly, the statistical analysis conducted on geographies consisting of 256,664,875 people shows a slight positive correlation between the proportion of Chileans and percentage of population with a disability in the United States with a correlation coefficient (R) of 0.076 and weighted average of 11.1%, a difference of 4.5%.
Disability Correlation Summary
| Measurement | Immigrants from Fiji | Chilean |
| Minimum | 6.6% | 4.1% |
| Maximum | 20.2% | 24.3% |
| Range | 13.6% | 20.2% |
| Mean | 11.8% | 11.9% |
| Median | 11.6% | 10.9% |
| Interquartile 25% (IQ1) | 10.8% | 9.5% |
| Interquartile 75% (IQ3) | 13.0% | 13.5% |
| Interquartile Range (IQR) | 2.2% | 4.0% |
| Standard Deviation (Sample) | 2.5% | 4.4% |
| Standard Deviation (Population) | 2.5% | 4.4% |
Similar Demographics by Disability
Demographics Similar to Immigrants from Fiji by Disability
In terms of disability, the demographic groups most similar to Immigrants from Fiji are Immigrants from Middle Africa (11.6%, a difference of 0.0%), Immigrants from Netherlands (11.6%, a difference of 0.010%), Immigrants from Ghana (11.6%, a difference of 0.090%), Immigrants from Guatemala (11.6%, a difference of 0.090%), and Immigrants from Kenya (11.6%, a difference of 0.14%).
| Demographics | Rating | Rank | Disability |
| Immigrants | Norway | 73.2 /100 | #149 | Good 11.6% |
| Romanians | 72.7 /100 | #150 | Good 11.6% |
| Immigrants | Kenya | 72.1 /100 | #151 | Good 11.6% |
| Immigrants | Moldova | 72.0 /100 | #152 | Good 11.6% |
| Immigrants | Ghana | 71.2 /100 | #153 | Good 11.6% |
| Immigrants | Guatemala | 71.1 /100 | #154 | Good 11.6% |
| Immigrants | Netherlands | 69.8 /100 | #155 | Good 11.6% |
| Immigrants | Fiji | 69.5 /100 | #156 | Good 11.6% |
| Immigrants | Middle Africa | 69.5 /100 | #157 | Good 11.6% |
| Armenians | 65.9 /100 | #158 | Good 11.6% |
| Guatemalans | 65.1 /100 | #159 | Good 11.6% |
| Immigrants | Barbados | 64.2 /100 | #160 | Good 11.6% |
| Immigrants | Cuba | 62.8 /100 | #161 | Good 11.6% |
| Immigrants | Haiti | 59.2 /100 | #162 | Average 11.7% |
| Immigrants | Trinidad and Tobago | 58.9 /100 | #163 | Average 11.7% |
Demographics Similar to Chileans by Disability
In terms of disability, the demographic groups most similar to Chileans are Immigrants from Switzerland (11.1%, a difference of 0.030%), Immigrants from Poland (11.1%, a difference of 0.050%), Immigrants from Sierra Leone (11.1%, a difference of 0.050%), Immigrants from Belarus (11.1%, a difference of 0.19%), and Immigrants from Russia (11.1%, a difference of 0.20%).
| Demographics | Rating | Rank | Disability |
| Immigrants | Vietnam | 99.4 /100 | #75 | Exceptional 11.0% |
| Sierra Leoneans | 99.3 /100 | #76 | Exceptional 11.0% |
| Immigrants | Belgium | 99.3 /100 | #77 | Exceptional 11.0% |
| Immigrants | Cameroon | 99.3 /100 | #78 | Exceptional 11.1% |
| Immigrants | Jordan | 99.3 /100 | #79 | Exceptional 11.1% |
| Immigrants | Ireland | 99.3 /100 | #80 | Exceptional 11.1% |
| Immigrants | Poland | 99.1 /100 | #81 | Exceptional 11.1% |
| Chileans | 99.1 /100 | #82 | Exceptional 11.1% |
| Immigrants | Switzerland | 99.0 /100 | #83 | Exceptional 11.1% |
| Immigrants | Sierra Leone | 99.0 /100 | #84 | Exceptional 11.1% |
| Immigrants | Belarus | 98.9 /100 | #85 | Exceptional 11.1% |
| Immigrants | Russia | 98.9 /100 | #86 | Exceptional 11.1% |
| Palestinians | 98.9 /100 | #87 | Exceptional 11.1% |
| Immigrants | Romania | 98.5 /100 | #88 | Exceptional 11.2% |
| Immigrants | South Africa | 98.2 /100 | #89 | Exceptional 11.2% |