Immigrants from Congo vs Chilean Bachelor's Degree
COMPARE
Immigrants from Congo
Chilean
Bachelor's Degree
Bachelor's Degree Comparison
Immigrants from Congo
Chileans
33.6%
BACHELOR'S DEGREE
1.0/ 100
METRIC RATING
247th/ 347
METRIC RANK
41.2%
BACHELOR'S DEGREE
97.5/ 100
METRIC RATING
103rd/ 347
METRIC RANK
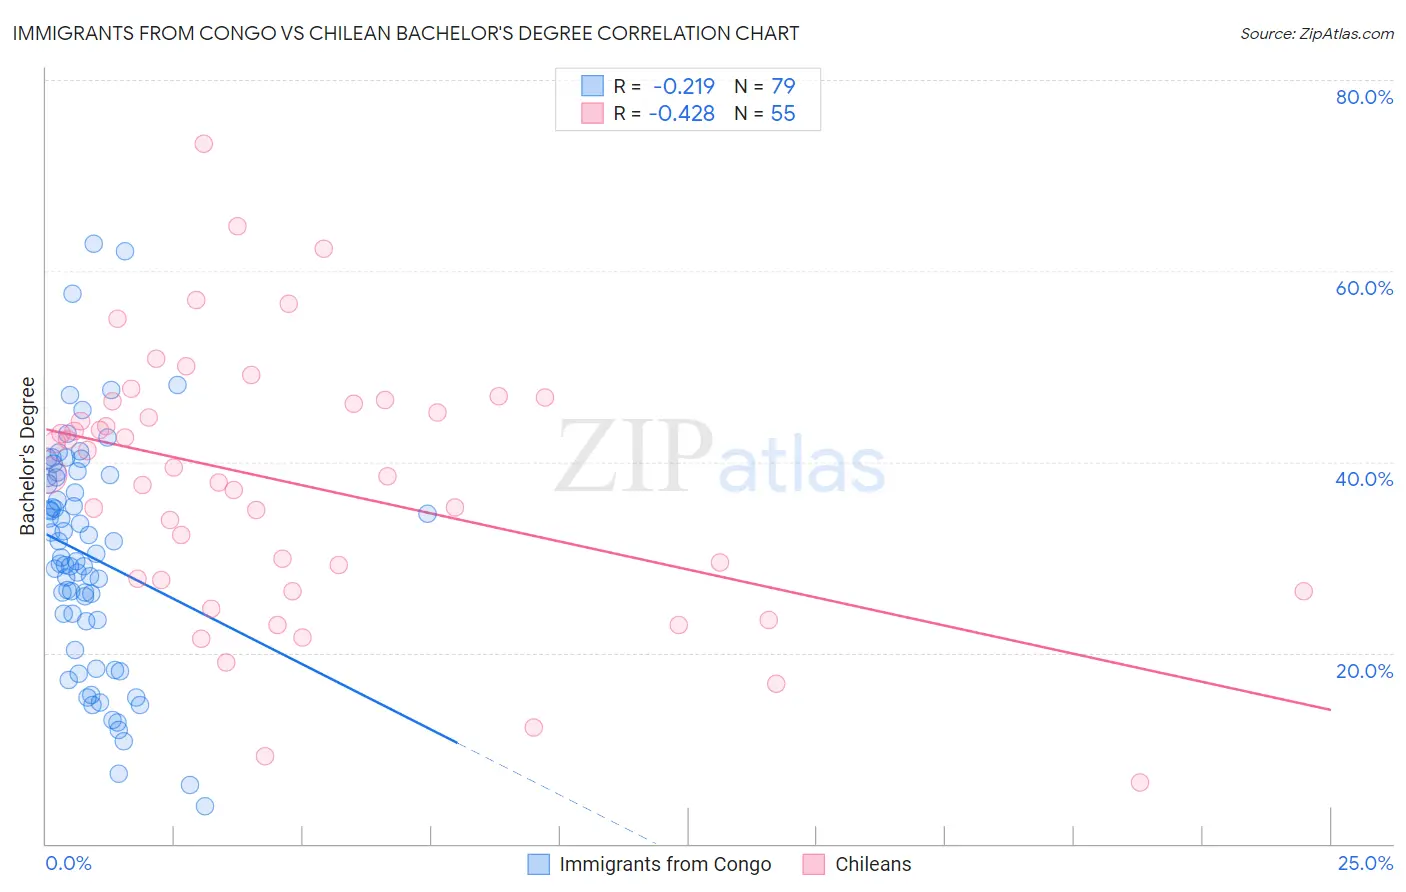
Immigrants from Congo vs Chilean Bachelor's Degree Correlation Chart
The statistical analysis conducted on geographies consisting of 92,128,050 people shows a weak negative correlation between the proportion of Immigrants from Congo and percentage of population with at least bachelor's degree education in the United States with a correlation coefficient (R) of -0.219 and weighted average of 33.6%. Similarly, the statistical analysis conducted on geographies consisting of 256,683,612 people shows a moderate negative correlation between the proportion of Chileans and percentage of population with at least bachelor's degree education in the United States with a correlation coefficient (R) of -0.428 and weighted average of 41.2%, a difference of 22.6%.
Bachelor's Degree Correlation Summary
| Measurement | Immigrants from Congo | Chilean |
| Minimum | 3.9% | 6.5% |
| Maximum | 62.9% | 73.3% |
| Range | 59.0% | 66.8% |
| Mean | 30.2% | 37.7% |
| Median | 30.0% | 38.6% |
| Interquartile 25% (IQ1) | 23.3% | 27.6% |
| Interquartile 75% (IQ3) | 38.4% | 46.4% |
| Interquartile Range (IQR) | 15.1% | 18.7% |
| Standard Deviation (Sample) | 12.1% | 13.7% |
| Standard Deviation (Population) | 12.0% | 13.6% |
Similar Demographics by Bachelor's Degree
Demographics Similar to Immigrants from Congo by Bachelor's Degree
In terms of bachelor's degree, the demographic groups most similar to Immigrants from Congo are Cree (33.6%, a difference of 0.010%), Jamaican (33.6%, a difference of 0.090%), Immigrants from Liberia (33.5%, a difference of 0.14%), Indonesian (33.5%, a difference of 0.15%), and Immigrants from Fiji (33.7%, a difference of 0.45%).
| Demographics | Rating | Rank | Bachelor's Degree |
| Tongans | 2.0 /100 | #240 | Tragic 34.3% |
| Immigrants | Cambodia | 1.9 /100 | #241 | Tragic 34.2% |
| Immigrants | Nonimmigrants | 1.8 /100 | #242 | Tragic 34.2% |
| Immigrants | Guyana | 1.4 /100 | #243 | Tragic 33.9% |
| Delaware | 1.2 /100 | #244 | Tragic 33.8% |
| Immigrants | Fiji | 1.2 /100 | #245 | Tragic 33.7% |
| Jamaicans | 1.0 /100 | #246 | Tragic 33.6% |
| Immigrants | Congo | 1.0 /100 | #247 | Tragic 33.6% |
| Cree | 1.0 /100 | #248 | Tragic 33.6% |
| Immigrants | Liberia | 0.9 /100 | #249 | Tragic 33.5% |
| Indonesians | 0.9 /100 | #250 | Tragic 33.5% |
| Japanese | 0.7 /100 | #251 | Tragic 33.3% |
| Immigrants | Bahamas | 0.7 /100 | #252 | Tragic 33.3% |
| U.S. Virgin Islanders | 0.7 /100 | #253 | Tragic 33.2% |
| Native Hawaiians | 0.7 /100 | #254 | Tragic 33.2% |
Demographics Similar to Chileans by Bachelor's Degree
In terms of bachelor's degree, the demographic groups most similar to Chileans are Jordanian (41.2%, a difference of 0.060%), Syrian (41.1%, a difference of 0.090%), Immigrants from Italy (41.3%, a difference of 0.34%), Alsatian (41.0%, a difference of 0.35%), and Northern European (41.0%, a difference of 0.52%).
| Demographics | Rating | Rank | Bachelor's Degree |
| Immigrants | Moldova | 98.4 /100 | #96 | Exceptional 41.6% |
| Romanians | 98.4 /100 | #97 | Exceptional 41.6% |
| Immigrants | Ukraine | 98.3 /100 | #98 | Exceptional 41.5% |
| Immigrants | England | 98.1 /100 | #99 | Exceptional 41.4% |
| Macedonians | 98.1 /100 | #100 | Exceptional 41.4% |
| Immigrants | Morocco | 98.0 /100 | #101 | Exceptional 41.4% |
| Immigrants | Italy | 97.8 /100 | #102 | Exceptional 41.3% |
| Chileans | 97.5 /100 | #103 | Exceptional 41.2% |
| Jordanians | 97.4 /100 | #104 | Exceptional 41.2% |
| Syrians | 97.4 /100 | #105 | Exceptional 41.1% |
| Alsatians | 97.0 /100 | #106 | Exceptional 41.0% |
| Northern Europeans | 96.8 /100 | #107 | Exceptional 41.0% |
| Ukrainians | 96.6 /100 | #108 | Exceptional 40.9% |
| Arabs | 96.6 /100 | #109 | Exceptional 40.9% |
| Albanians | 96.5 /100 | #110 | Exceptional 40.9% |