Immigrants from Cambodia vs Immigrants from Scotland Vision Disability
COMPARE
Immigrants from Cambodia
Immigrants from Scotland
Vision Disability
Vision Disability Comparison
Immigrants from Cambodia
Immigrants from Scotland
2.3%
VISION DISABILITY
1.1/ 100
METRIC RATING
238th/ 347
METRIC RANK
2.1%
VISION DISABILITY
90.4/ 100
METRIC RATING
121st/ 347
METRIC RANK
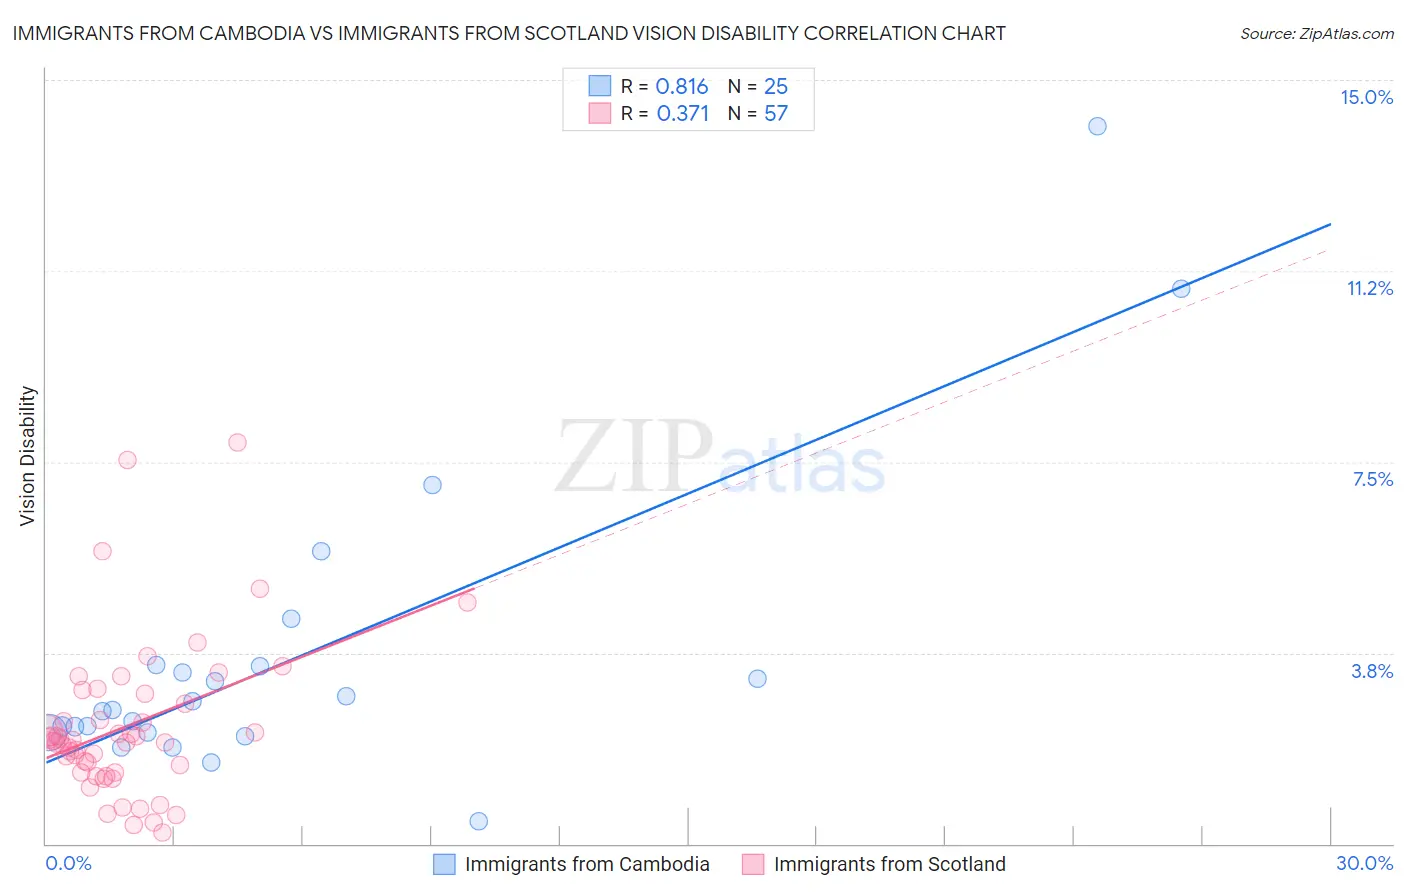
Immigrants from Cambodia vs Immigrants from Scotland Vision Disability Correlation Chart
The statistical analysis conducted on geographies consisting of 205,117,517 people shows a very strong positive correlation between the proportion of Immigrants from Cambodia and percentage of population with vision disability in the United States with a correlation coefficient (R) of 0.816 and weighted average of 2.3%. Similarly, the statistical analysis conducted on geographies consisting of 196,324,297 people shows a mild positive correlation between the proportion of Immigrants from Scotland and percentage of population with vision disability in the United States with a correlation coefficient (R) of 0.371 and weighted average of 2.1%, a difference of 11.0%.
Vision Disability Correlation Summary
| Measurement | Immigrants from Cambodia | Immigrants from Scotland |
| Minimum | 0.43% | 0.21% |
| Maximum | 14.1% | 7.9% |
| Range | 13.7% | 7.7% |
| Mean | 3.7% | 2.3% |
| Median | 2.6% | 2.0% |
| Interquartile 25% (IQ1) | 2.2% | 1.4% |
| Interquartile 75% (IQ3) | 3.5% | 2.8% |
| Interquartile Range (IQR) | 1.3% | 1.4% |
| Standard Deviation (Sample) | 3.0% | 1.5% |
| Standard Deviation (Population) | 2.9% | 1.5% |
Similar Demographics by Vision Disability
Demographics Similar to Immigrants from Cambodia by Vision Disability
In terms of vision disability, the demographic groups most similar to Immigrants from Cambodia are English (2.3%, a difference of 0.020%), Immigrants from Portugal (2.3%, a difference of 0.27%), Panamanian (2.3%, a difference of 0.27%), Malaysian (2.3%, a difference of 0.30%), and Immigrants from Congo (2.3%, a difference of 0.32%).
| Demographics | Rating | Rank | Vision Disability |
| Immigrants | Ecuador | 2.0 /100 | #231 | Tragic 2.3% |
| German Russians | 1.8 /100 | #232 | Tragic 2.3% |
| Central Americans | 1.8 /100 | #233 | Tragic 2.3% |
| Scottish | 1.6 /100 | #234 | Tragic 2.3% |
| Marshallese | 1.5 /100 | #235 | Tragic 2.3% |
| Immigrants | Congo | 1.4 /100 | #236 | Tragic 2.3% |
| Immigrants | Portugal | 1.4 /100 | #237 | Tragic 2.3% |
| Immigrants | Cambodia | 1.1 /100 | #238 | Tragic 2.3% |
| English | 1.1 /100 | #239 | Tragic 2.3% |
| Panamanians | 0.9 /100 | #240 | Tragic 2.3% |
| Malaysians | 0.9 /100 | #241 | Tragic 2.3% |
| Immigrants | Panama | 0.8 /100 | #242 | Tragic 2.3% |
| Immigrants | Nicaragua | 0.6 /100 | #243 | Tragic 2.3% |
| Immigrants | West Indies | 0.6 /100 | #244 | Tragic 2.3% |
| Alsatians | 0.6 /100 | #245 | Tragic 2.3% |
Demographics Similar to Immigrants from Scotland by Vision Disability
In terms of vision disability, the demographic groups most similar to Immigrants from Scotland are Immigrants from Ukraine (2.1%, a difference of 0.010%), Immigrants from Albania (2.1%, a difference of 0.010%), Immigrants from Spain (2.1%, a difference of 0.11%), Immigrants from Zimbabwe (2.1%, a difference of 0.12%), and Immigrants from Venezuela (2.1%, a difference of 0.12%).
| Demographics | Rating | Rank | Vision Disability |
| Croatians | 92.3 /100 | #114 | Exceptional 2.1% |
| Immigrants | Vietnam | 92.2 /100 | #115 | Exceptional 2.1% |
| Ugandans | 92.2 /100 | #116 | Exceptional 2.1% |
| Poles | 92.0 /100 | #117 | Exceptional 2.1% |
| Immigrants | Philippines | 91.4 /100 | #118 | Exceptional 2.1% |
| Immigrants | Uganda | 91.4 /100 | #119 | Exceptional 2.1% |
| Immigrants | Zimbabwe | 91.0 /100 | #120 | Exceptional 2.1% |
| Immigrants | Scotland | 90.4 /100 | #121 | Exceptional 2.1% |
| Immigrants | Ukraine | 90.4 /100 | #122 | Exceptional 2.1% |
| Immigrants | Albania | 90.4 /100 | #123 | Exceptional 2.1% |
| Immigrants | Spain | 89.8 /100 | #124 | Excellent 2.1% |
| Immigrants | Venezuela | 89.8 /100 | #125 | Excellent 2.1% |
| Immigrants | Peru | 89.5 /100 | #126 | Excellent 2.1% |
| Sudanese | 89.2 /100 | #127 | Excellent 2.1% |
| Immigrants | Chile | 89.0 /100 | #128 | Excellent 2.1% |