Immigrants from England vs Immigrants from Scotland Disability Age 5 to 17
COMPARE
Immigrants from England
Immigrants from Scotland
Disability Age 5 to 17
Disability Age 5 to 17 Comparison
Immigrants from England
Immigrants from Scotland
5.6%
DISABILITY AGE 5 TO 17
36.4/ 100
METRIC RATING
181st/ 347
METRIC RANK
5.6%
DISABILITY AGE 5 TO 17
61.9/ 100
METRIC RATING
164th/ 347
METRIC RANK
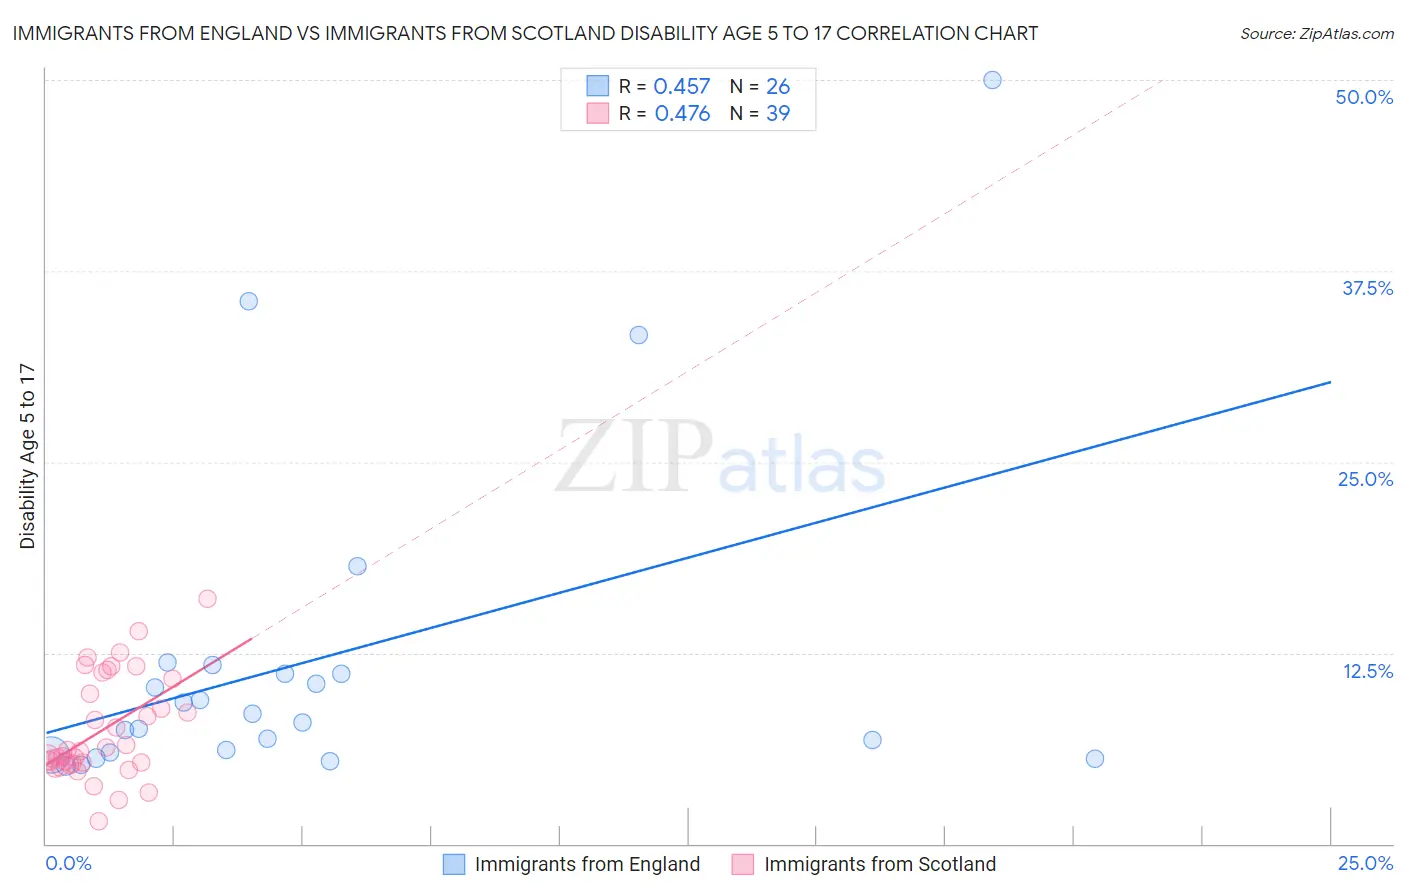
Immigrants from England vs Immigrants from Scotland Disability Age 5 to 17 Correlation Chart
The statistical analysis conducted on geographies consisting of 388,045,043 people shows a moderate positive correlation between the proportion of Immigrants from England and percentage of population with a disability between the ages 5 and 17 in the United States with a correlation coefficient (R) of 0.457 and weighted average of 5.6%. Similarly, the statistical analysis conducted on geographies consisting of 195,273,569 people shows a moderate positive correlation between the proportion of Immigrants from Scotland and percentage of population with a disability between the ages 5 and 17 in the United States with a correlation coefficient (R) of 0.476 and weighted average of 5.6%, a difference of 1.3%.
Disability Age 5 to 17 Correlation Summary
| Measurement | Immigrants from England | Immigrants from Scotland |
| Minimum | 5.1% | 1.5% |
| Maximum | 50.0% | 16.0% |
| Range | 44.9% | 14.5% |
| Mean | 12.0% | 7.4% |
| Median | 8.2% | 6.0% |
| Interquartile 25% (IQ1) | 6.0% | 5.2% |
| Interquartile 75% (IQ3) | 11.1% | 10.8% |
| Interquartile Range (IQR) | 5.2% | 5.6% |
| Standard Deviation (Sample) | 10.9% | 3.4% |
| Standard Deviation (Population) | 10.7% | 3.3% |
Demographics Similar to Immigrants from England and Immigrants from Scotland by Disability Age 5 to 17
In terms of disability age 5 to 17, the demographic groups most similar to Immigrants from England are Mexican American Indian (5.6%, a difference of 0.060%), Immigrants from Uruguay (5.6%, a difference of 0.070%), Immigrants from Barbados (5.6%, a difference of 0.21%), Immigrants from Trinidad and Tobago (5.6%, a difference of 0.57%), and Immigrants from Western Europe (5.6%, a difference of 0.58%). Similarly, the demographic groups most similar to Immigrants from Scotland are Lebanese (5.6%, a difference of 0.030%), Greek (5.6%, a difference of 0.070%), Immigrants from Southern Europe (5.6%, a difference of 0.11%), Immigrants from Burma/Myanmar (5.6%, a difference of 0.13%), and Zimbabwean (5.5%, a difference of 0.29%).
| Demographics | Rating | Rank | Disability Age 5 to 17 |
| Zimbabweans | 67.2 /100 | #162 | Good 5.5% |
| Immigrants | Southern Europe | 64.0 /100 | #163 | Good 5.6% |
| Immigrants | Scotland | 61.9 /100 | #164 | Good 5.6% |
| Lebanese | 61.4 /100 | #165 | Good 5.6% |
| Greeks | 60.6 /100 | #166 | Good 5.6% |
| Immigrants | Burma/Myanmar | 59.3 /100 | #167 | Average 5.6% |
| Iraqis | 56.0 /100 | #168 | Average 5.6% |
| Immigrants | Norway | 55.7 /100 | #169 | Average 5.6% |
| Serbians | 54.0 /100 | #170 | Average 5.6% |
| Immigrants | Iraq | 53.9 /100 | #171 | Average 5.6% |
| Ukrainians | 51.5 /100 | #172 | Average 5.6% |
| Uruguayans | 51.0 /100 | #173 | Average 5.6% |
| Costa Ricans | 50.0 /100 | #174 | Average 5.6% |
| Shoshone | 49.4 /100 | #175 | Average 5.6% |
| Immigrants | Central America | 49.4 /100 | #176 | Average 5.6% |
| Immigrants | Western Europe | 47.8 /100 | #177 | Average 5.6% |
| Immigrants | Trinidad and Tobago | 47.6 /100 | #178 | Average 5.6% |
| Immigrants | Barbados | 40.5 /100 | #179 | Average 5.6% |
| Immigrants | Uruguay | 37.7 /100 | #180 | Fair 5.6% |
| Immigrants | England | 36.4 /100 | #181 | Fair 5.6% |
| Mexican American Indians | 35.2 /100 | #182 | Fair 5.6% |