Immigrants from Cambodia vs Immigrants from Scotland Unemployment Among Ages 60 to 64 years
COMPARE
Immigrants from Cambodia
Immigrants from Scotland
Unemployment Among Ages 60 to 64 years
Unemployment Among Ages 60 to 64 years Comparison
Immigrants from Cambodia
Immigrants from Scotland
5.1%
UNEMPLOYMENT AMONG AGES 60 TO 64 YEARS
0.9/ 100
METRIC RATING
250th/ 347
METRIC RANK
4.6%
UNEMPLOYMENT AMONG AGES 60 TO 64 YEARS
99.6/ 100
METRIC RATING
67th/ 347
METRIC RANK
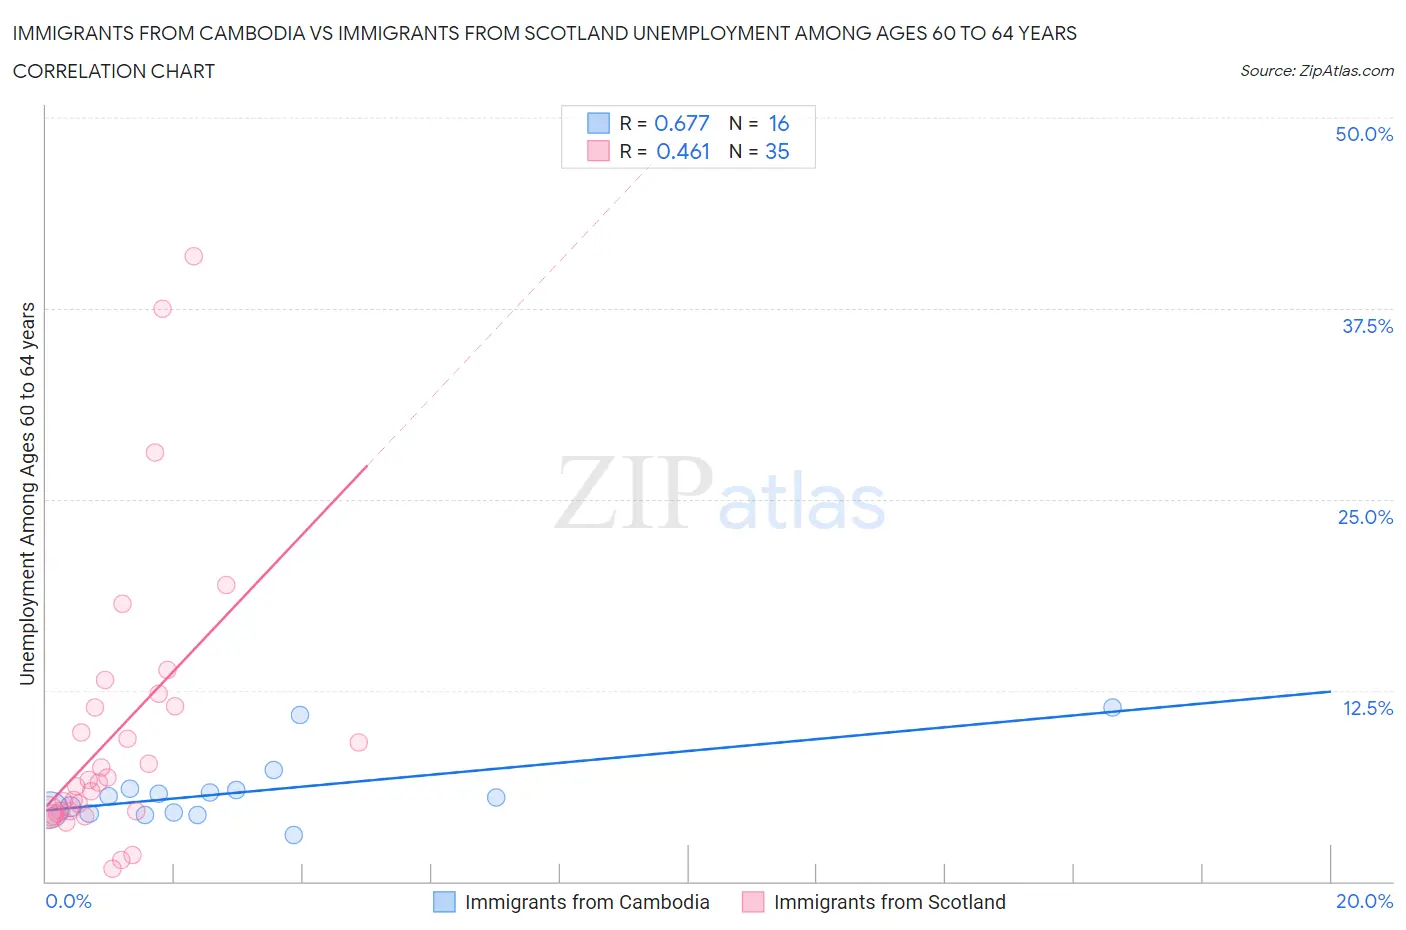
Immigrants from Cambodia vs Immigrants from Scotland Unemployment Among Ages 60 to 64 years Correlation Chart
The statistical analysis conducted on geographies consisting of 196,033,881 people shows a significant positive correlation between the proportion of Immigrants from Cambodia and unemployment rate among population between the ages 60 and 64 in the United States with a correlation coefficient (R) of 0.677 and weighted average of 5.1%. Similarly, the statistical analysis conducted on geographies consisting of 185,817,257 people shows a moderate positive correlation between the proportion of Immigrants from Scotland and unemployment rate among population between the ages 60 and 64 in the United States with a correlation coefficient (R) of 0.461 and weighted average of 4.6%, a difference of 9.5%.
Unemployment Among Ages 60 to 64 years Correlation Summary
| Measurement | Immigrants from Cambodia | Immigrants from Scotland |
| Minimum | 3.0% | 0.84% |
| Maximum | 11.4% | 40.9% |
| Range | 8.4% | 40.1% |
| Mean | 5.9% | 9.7% |
| Median | 5.5% | 6.5% |
| Interquartile 25% (IQ1) | 4.4% | 4.5% |
| Interquartile 75% (IQ3) | 6.0% | 11.5% |
| Interquartile Range (IQR) | 1.6% | 7.0% |
| Standard Deviation (Sample) | 2.3% | 9.2% |
| Standard Deviation (Population) | 2.2% | 9.1% |
Similar Demographics by Unemployment Among Ages 60 to 64 years
Demographics Similar to Immigrants from Cambodia by Unemployment Among Ages 60 to 64 years
In terms of unemployment among ages 60 to 64 years, the demographic groups most similar to Immigrants from Cambodia are Immigrants from Uruguay (5.1%, a difference of 0.030%), Immigrants from Switzerland (5.1%, a difference of 0.050%), Immigrants from China (5.1%, a difference of 0.080%), South American (5.1%, a difference of 0.10%), and Costa Rican (5.1%, a difference of 0.11%).
| Demographics | Rating | Rank | Unemployment Among Ages 60 to 64 years |
| Immigrants | Philippines | 1.9 /100 | #243 | Tragic 5.0% |
| Peruvians | 1.6 /100 | #244 | Tragic 5.0% |
| Comanche | 1.3 /100 | #245 | Tragic 5.0% |
| Immigrants | South America | 1.1 /100 | #246 | Tragic 5.0% |
| Immigrants | North Macedonia | 1.1 /100 | #247 | Tragic 5.0% |
| Immigrants | Fiji | 1.1 /100 | #248 | Tragic 5.1% |
| South Americans | 1.0 /100 | #249 | Tragic 5.1% |
| Immigrants | Cambodia | 0.9 /100 | #250 | Tragic 5.1% |
| Immigrants | Uruguay | 0.9 /100 | #251 | Tragic 5.1% |
| Immigrants | Switzerland | 0.9 /100 | #252 | Tragic 5.1% |
| Immigrants | China | 0.9 /100 | #253 | Tragic 5.1% |
| Costa Ricans | 0.8 /100 | #254 | Tragic 5.1% |
| Estonians | 0.8 /100 | #255 | Tragic 5.1% |
| Immigrants | Peru | 0.7 /100 | #256 | Tragic 5.1% |
| Japanese | 0.6 /100 | #257 | Tragic 5.1% |
Demographics Similar to Immigrants from Scotland by Unemployment Among Ages 60 to 64 years
In terms of unemployment among ages 60 to 64 years, the demographic groups most similar to Immigrants from Scotland are Hawaiian (4.6%, a difference of 0.030%), Immigrants from Laos (4.6%, a difference of 0.030%), Creek (4.6%, a difference of 0.13%), Croatian (4.6%, a difference of 0.21%), and Jordanian (4.6%, a difference of 0.23%).
| Demographics | Rating | Rank | Unemployment Among Ages 60 to 64 years |
| Puget Sound Salish | 99.8 /100 | #60 | Exceptional 4.6% |
| Lebanese | 99.8 /100 | #61 | Exceptional 4.6% |
| Senegalese | 99.7 /100 | #62 | Exceptional 4.6% |
| Czechoslovakians | 99.7 /100 | #63 | Exceptional 4.6% |
| Immigrants | Middle Africa | 99.7 /100 | #64 | Exceptional 4.6% |
| Jordanians | 99.7 /100 | #65 | Exceptional 4.6% |
| Hawaiians | 99.6 /100 | #66 | Exceptional 4.6% |
| Immigrants | Scotland | 99.6 /100 | #67 | Exceptional 4.6% |
| Immigrants | Laos | 99.6 /100 | #68 | Exceptional 4.6% |
| Creek | 99.6 /100 | #69 | Exceptional 4.6% |
| Croatians | 99.5 /100 | #70 | Exceptional 4.6% |
| Slavs | 99.5 /100 | #71 | Exceptional 4.6% |
| Tongans | 99.5 /100 | #72 | Exceptional 4.6% |
| Immigrants | Eastern Africa | 99.5 /100 | #73 | Exceptional 4.6% |
| Northern Europeans | 99.3 /100 | #74 | Exceptional 4.6% |