Immigrants from Nigeria vs Immigrants from Scotland Disability Age 5 to 17
COMPARE
Immigrants from Nigeria
Immigrants from Scotland
Disability Age 5 to 17
Disability Age 5 to 17 Comparison
Immigrants from Nigeria
Immigrants from Scotland
5.7%
DISABILITY AGE 5 TO 17
23.4/ 100
METRIC RATING
195th/ 347
METRIC RANK
5.6%
DISABILITY AGE 5 TO 17
61.9/ 100
METRIC RATING
164th/ 347
METRIC RANK
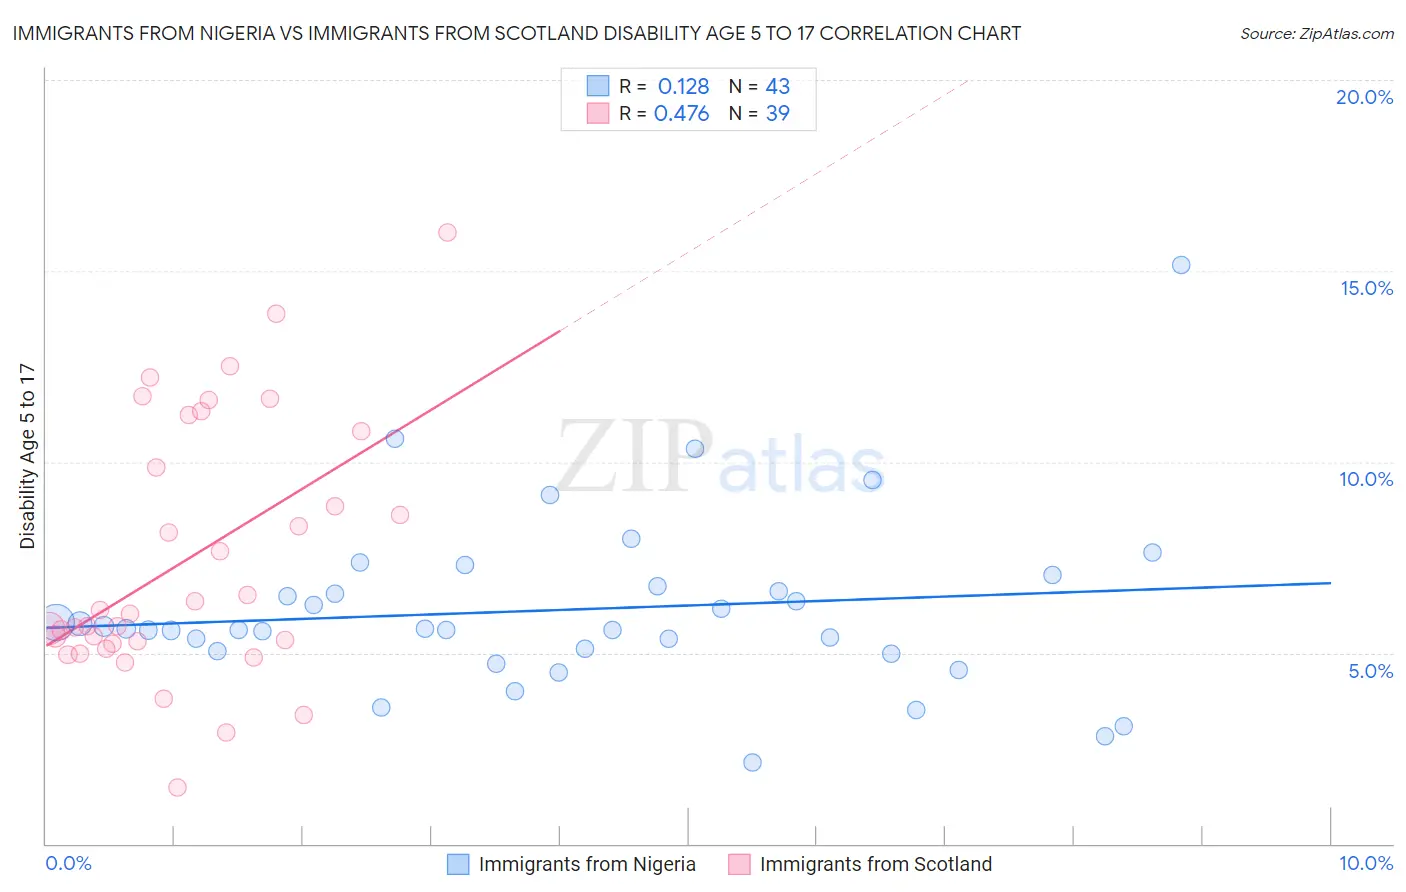
Immigrants from Nigeria vs Immigrants from Scotland Disability Age 5 to 17 Correlation Chart
The statistical analysis conducted on geographies consisting of 282,146,479 people shows a poor positive correlation between the proportion of Immigrants from Nigeria and percentage of population with a disability between the ages 5 and 17 in the United States with a correlation coefficient (R) of 0.128 and weighted average of 5.7%. Similarly, the statistical analysis conducted on geographies consisting of 195,273,569 people shows a moderate positive correlation between the proportion of Immigrants from Scotland and percentage of population with a disability between the ages 5 and 17 in the United States with a correlation coefficient (R) of 0.476 and weighted average of 5.6%, a difference of 2.1%.
Disability Age 5 to 17 Correlation Summary
| Measurement | Immigrants from Nigeria | Immigrants from Scotland |
| Minimum | 2.1% | 1.5% |
| Maximum | 15.2% | 16.0% |
| Range | 13.1% | 14.5% |
| Mean | 6.1% | 7.4% |
| Median | 5.6% | 6.0% |
| Interquartile 25% (IQ1) | 5.0% | 5.2% |
| Interquartile 75% (IQ3) | 6.8% | 10.8% |
| Interquartile Range (IQR) | 1.7% | 5.6% |
| Standard Deviation (Sample) | 2.3% | 3.4% |
| Standard Deviation (Population) | 2.3% | 3.3% |
Similar Demographics by Disability Age 5 to 17
Demographics Similar to Immigrants from Nigeria by Disability Age 5 to 17
In terms of disability age 5 to 17, the demographic groups most similar to Immigrants from Nigeria are Croatian (5.7%, a difference of 0.010%), Inupiat (5.7%, a difference of 0.010%), Immigrants from North America (5.7%, a difference of 0.020%), Immigrants from Canada (5.7%, a difference of 0.17%), and Norwegian (5.7%, a difference of 0.18%).
| Demographics | Rating | Rank | Disability Age 5 to 17 |
| Marshallese | 28.1 /100 | #188 | Fair 5.7% |
| Pueblo | 27.5 /100 | #189 | Fair 5.7% |
| Immigrants | Eastern Africa | 27.3 /100 | #190 | Fair 5.7% |
| Danes | 26.5 /100 | #191 | Fair 5.7% |
| Immigrants | Bosnia and Herzegovina | 26.3 /100 | #192 | Fair 5.7% |
| Immigrants | Canada | 26.1 /100 | #193 | Fair 5.7% |
| Croatians | 23.6 /100 | #194 | Fair 5.7% |
| Immigrants | Nigeria | 23.4 /100 | #195 | Fair 5.7% |
| Inupiat | 23.3 /100 | #196 | Fair 5.7% |
| Immigrants | North America | 23.1 /100 | #197 | Fair 5.7% |
| Norwegians | 20.9 /100 | #198 | Fair 5.7% |
| Northern Europeans | 15.2 /100 | #199 | Poor 5.7% |
| Icelanders | 14.6 /100 | #200 | Poor 5.7% |
| Basques | 13.7 /100 | #201 | Poor 5.7% |
| Austrians | 13.2 /100 | #202 | Poor 5.7% |
Demographics Similar to Immigrants from Scotland by Disability Age 5 to 17
In terms of disability age 5 to 17, the demographic groups most similar to Immigrants from Scotland are Lebanese (5.6%, a difference of 0.030%), Greek (5.6%, a difference of 0.070%), Immigrants from Southern Europe (5.6%, a difference of 0.11%), Immigrants from Burma/Myanmar (5.6%, a difference of 0.13%), and Zimbabwean (5.5%, a difference of 0.29%).
| Demographics | Rating | Rank | Disability Age 5 to 17 |
| Immigrants | Costa Rica | 77.9 /100 | #157 | Good 5.5% |
| Immigrants | Nepal | 77.1 /100 | #158 | Good 5.5% |
| Immigrants | Zimbabwe | 75.3 /100 | #159 | Good 5.5% |
| South Africans | 73.3 /100 | #160 | Good 5.5% |
| Immigrants | Saudi Arabia | 69.1 /100 | #161 | Good 5.5% |
| Zimbabweans | 67.2 /100 | #162 | Good 5.5% |
| Immigrants | Southern Europe | 64.0 /100 | #163 | Good 5.6% |
| Immigrants | Scotland | 61.9 /100 | #164 | Good 5.6% |
| Lebanese | 61.4 /100 | #165 | Good 5.6% |
| Greeks | 60.6 /100 | #166 | Good 5.6% |
| Immigrants | Burma/Myanmar | 59.3 /100 | #167 | Average 5.6% |
| Iraqis | 56.0 /100 | #168 | Average 5.6% |
| Immigrants | Norway | 55.7 /100 | #169 | Average 5.6% |
| Serbians | 54.0 /100 | #170 | Average 5.6% |
| Immigrants | Iraq | 53.9 /100 | #171 | Average 5.6% |