Immigrants from Burma/Myanmar vs French Disability Age Over 75
COMPARE
Immigrants from Burma/Myanmar
French
Disability Age Over 75
Disability Age Over 75 Comparison
Immigrants from Burma/Myanmar
French
47.9%
DISABILITY AGE OVER 75
11.7/ 100
METRIC RATING
212th/ 347
METRIC RANK
47.2%
DISABILITY AGE OVER 75
64.6/ 100
METRIC RATING
164th/ 347
METRIC RANK
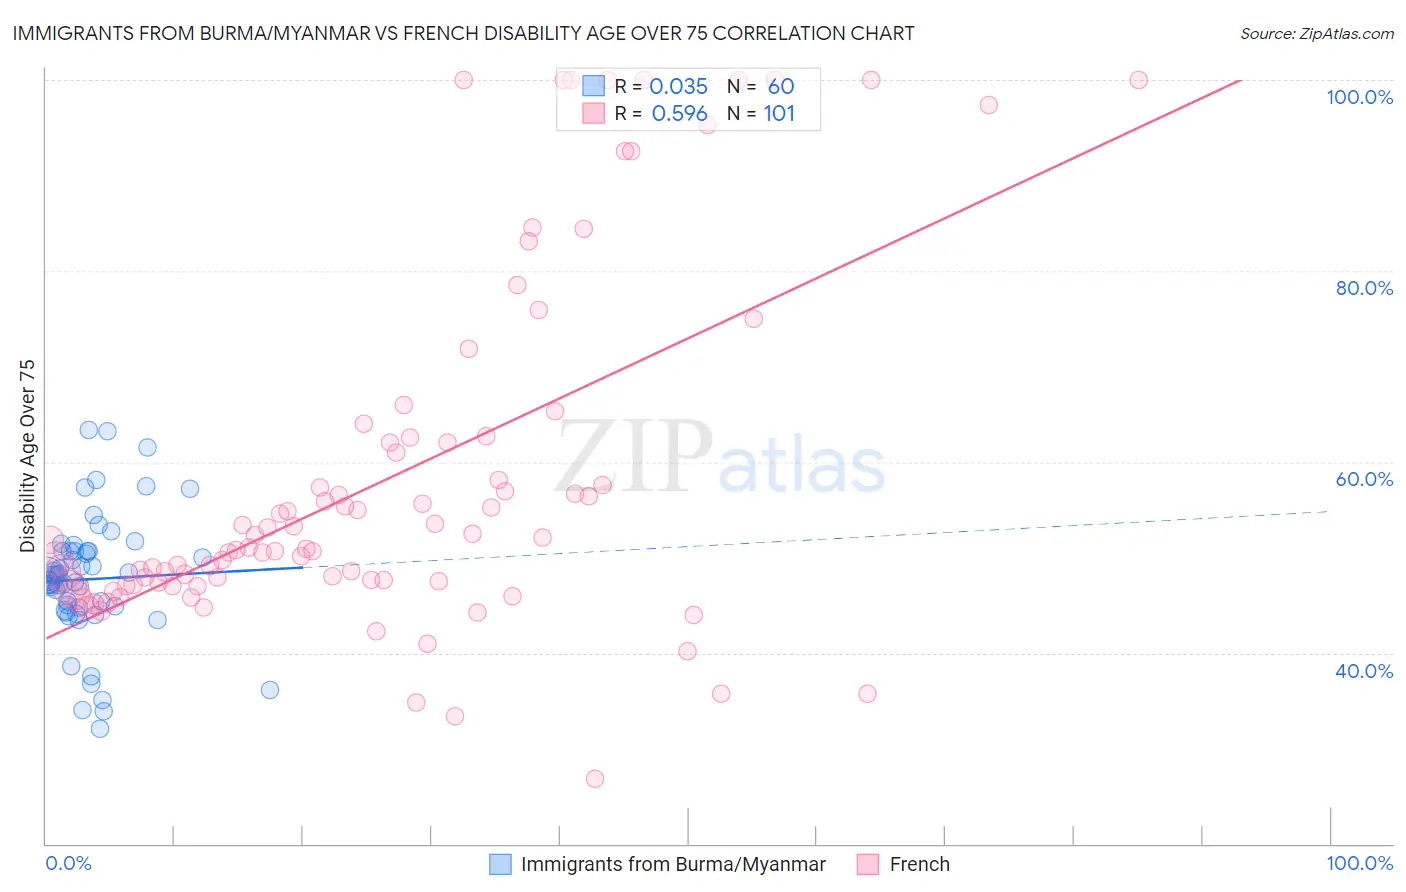
Immigrants from Burma/Myanmar vs French Disability Age Over 75 Correlation Chart
The statistical analysis conducted on geographies consisting of 172,144,400 people shows no correlation between the proportion of Immigrants from Burma/Myanmar and percentage of population with a disability over the age of 75 in the United States with a correlation coefficient (R) of 0.035 and weighted average of 47.9%. Similarly, the statistical analysis conducted on geographies consisting of 570,272,954 people shows a substantial positive correlation between the proportion of French and percentage of population with a disability over the age of 75 in the United States with a correlation coefficient (R) of 0.596 and weighted average of 47.2%, a difference of 1.5%.
Disability Age Over 75 Correlation Summary
| Measurement | Immigrants from Burma/Myanmar | French |
| Minimum | 32.0% | 26.8% |
| Maximum | 63.4% | 100.0% |
| Range | 31.4% | 73.2% |
| Mean | 47.7% | 58.3% |
| Median | 48.1% | 51.0% |
| Interquartile 25% (IQ1) | 44.6% | 47.1% |
| Interquartile 75% (IQ3) | 50.7% | 62.3% |
| Interquartile Range (IQR) | 6.1% | 15.2% |
| Standard Deviation (Sample) | 6.7% | 18.4% |
| Standard Deviation (Population) | 6.6% | 18.3% |
Similar Demographics by Disability Age Over 75
Demographics Similar to Immigrants from Burma/Myanmar by Disability Age Over 75
In terms of disability age over 75, the demographic groups most similar to Immigrants from Burma/Myanmar are Panamanian (47.9%, a difference of 0.0%), Vietnamese (47.9%, a difference of 0.010%), Laotian (47.9%, a difference of 0.010%), Immigrants from Barbados (47.9%, a difference of 0.060%), and Senegalese (47.9%, a difference of 0.060%).
| Demographics | Rating | Rank | Disability Age Over 75 |
| Immigrants | Ghana | 19.1 /100 | #205 | Poor 47.7% |
| Jamaicans | 19.0 /100 | #206 | Poor 47.7% |
| Immigrants | Syria | 17.4 /100 | #207 | Poor 47.8% |
| Immigrants | Senegal | 16.9 /100 | #208 | Poor 47.8% |
| Immigrants | Indonesia | 14.2 /100 | #209 | Poor 47.8% |
| Vietnamese | 11.9 /100 | #210 | Poor 47.9% |
| Panamanians | 11.8 /100 | #211 | Poor 47.9% |
| Immigrants | Burma/Myanmar | 11.7 /100 | #212 | Poor 47.9% |
| Laotians | 11.5 /100 | #213 | Poor 47.9% |
| Immigrants | Barbados | 10.7 /100 | #214 | Poor 47.9% |
| Senegalese | 10.7 /100 | #215 | Poor 47.9% |
| Immigrants | Panama | 10.2 /100 | #216 | Poor 47.9% |
| Immigrants | Grenada | 9.4 /100 | #217 | Tragic 47.9% |
| Immigrants | Western Africa | 8.3 /100 | #218 | Tragic 48.0% |
| Immigrants | Western Asia | 7.5 /100 | #219 | Tragic 48.0% |
Demographics Similar to French by Disability Age Over 75
In terms of disability age over 75, the demographic groups most similar to French are Immigrants from Zimbabwe (47.2%, a difference of 0.0%), Immigrants from Sierra Leone (47.2%, a difference of 0.010%), Immigrants from Eastern Africa (47.2%, a difference of 0.020%), Pennsylvania German (47.2%, a difference of 0.030%), and Moroccan (47.2%, a difference of 0.040%).
| Demographics | Rating | Rank | Disability Age Over 75 |
| Bhutanese | 72.6 /100 | #157 | Good 47.1% |
| Immigrants | Guyana | 71.9 /100 | #158 | Good 47.1% |
| Immigrants | Morocco | 71.4 /100 | #159 | Good 47.1% |
| Immigrants | Middle Africa | 68.3 /100 | #160 | Good 47.1% |
| South American Indians | 68.1 /100 | #161 | Good 47.1% |
| Pennsylvania Germans | 66.0 /100 | #162 | Good 47.2% |
| Immigrants | Eastern Africa | 65.5 /100 | #163 | Good 47.2% |
| French | 64.6 /100 | #164 | Good 47.2% |
| Immigrants | Zimbabwe | 64.4 /100 | #165 | Good 47.2% |
| Immigrants | Sierra Leone | 64.4 /100 | #166 | Good 47.2% |
| Moroccans | 62.9 /100 | #167 | Good 47.2% |
| Kenyans | 58.8 /100 | #168 | Average 47.2% |
| Celtics | 58.7 /100 | #169 | Average 47.2% |
| German Russians | 56.2 /100 | #170 | Average 47.3% |
| Immigrants | Africa | 53.6 /100 | #171 | Average 47.3% |