Immigrants from Burma/Myanmar vs Danish Disability Age Over 75
COMPARE
Immigrants from Burma/Myanmar
Danish
Disability Age Over 75
Disability Age Over 75 Comparison
Immigrants from Burma/Myanmar
Danes
47.9%
DISABILITY AGE OVER 75
11.7/ 100
METRIC RATING
212th/ 347
METRIC RANK
46.2%
DISABILITY AGE OVER 75
98.6/ 100
METRIC RATING
87th/ 347
METRIC RANK
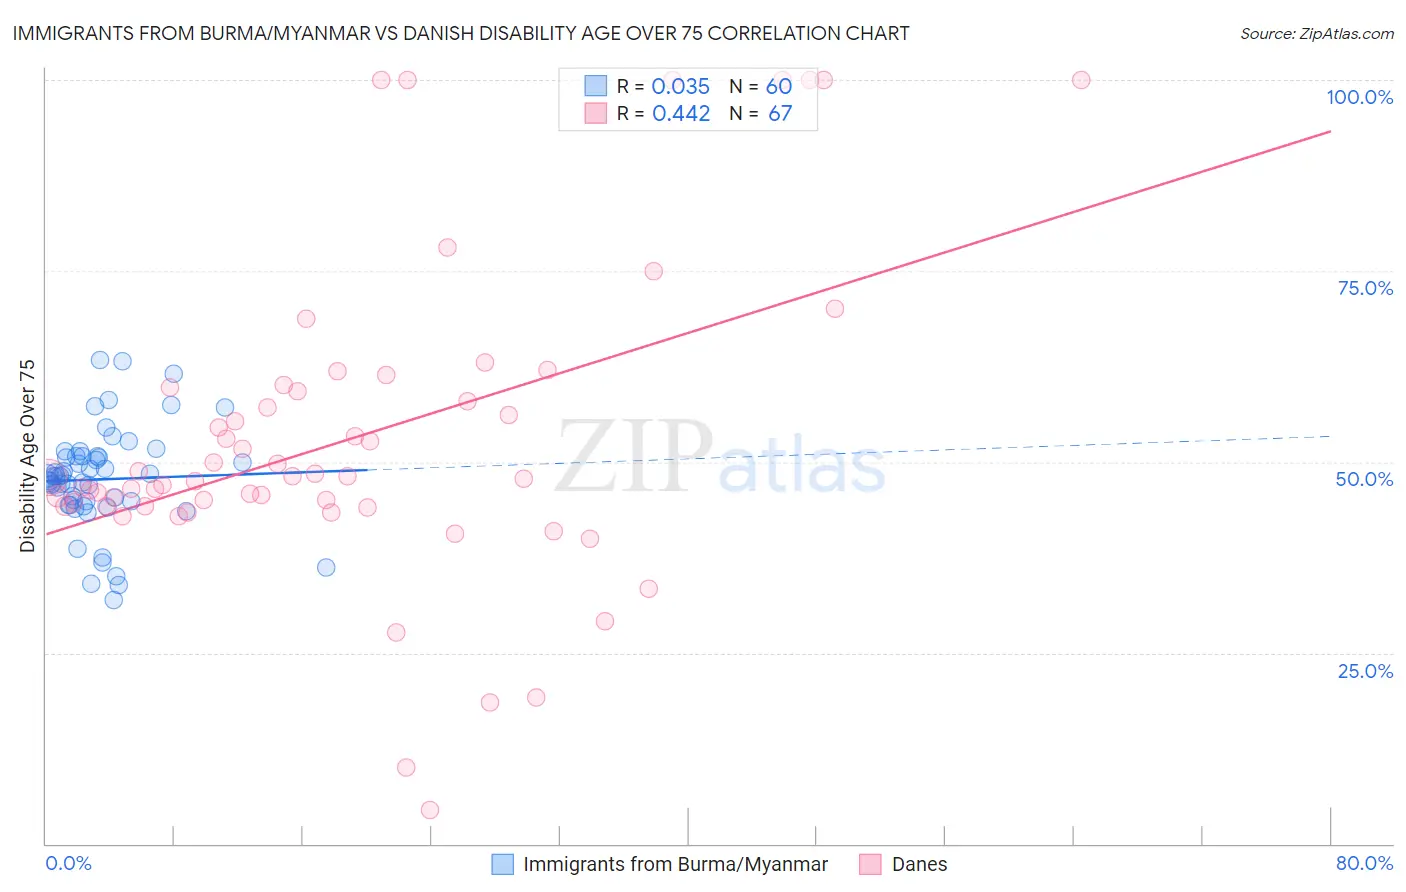
Immigrants from Burma/Myanmar vs Danish Disability Age Over 75 Correlation Chart
The statistical analysis conducted on geographies consisting of 172,144,400 people shows no correlation between the proportion of Immigrants from Burma/Myanmar and percentage of population with a disability over the age of 75 in the United States with a correlation coefficient (R) of 0.035 and weighted average of 47.9%. Similarly, the statistical analysis conducted on geographies consisting of 473,146,755 people shows a moderate positive correlation between the proportion of Danes and percentage of population with a disability over the age of 75 in the United States with a correlation coefficient (R) of 0.442 and weighted average of 46.2%, a difference of 3.6%.
Disability Age Over 75 Correlation Summary
| Measurement | Immigrants from Burma/Myanmar | Danish |
| Minimum | 32.0% | 4.4% |
| Maximum | 63.4% | 100.0% |
| Range | 31.4% | 95.6% |
| Mean | 47.7% | 53.1% |
| Median | 48.1% | 47.9% |
| Interquartile 25% (IQ1) | 44.6% | 44.1% |
| Interquartile 75% (IQ3) | 50.7% | 59.7% |
| Interquartile Range (IQR) | 6.1% | 15.6% |
| Standard Deviation (Sample) | 6.7% | 20.5% |
| Standard Deviation (Population) | 6.6% | 20.4% |
Similar Demographics by Disability Age Over 75
Demographics Similar to Immigrants from Burma/Myanmar by Disability Age Over 75
In terms of disability age over 75, the demographic groups most similar to Immigrants from Burma/Myanmar are Panamanian (47.9%, a difference of 0.0%), Vietnamese (47.9%, a difference of 0.010%), Laotian (47.9%, a difference of 0.010%), Immigrants from Barbados (47.9%, a difference of 0.060%), and Senegalese (47.9%, a difference of 0.060%).
| Demographics | Rating | Rank | Disability Age Over 75 |
| Immigrants | Ghana | 19.1 /100 | #205 | Poor 47.7% |
| Jamaicans | 19.0 /100 | #206 | Poor 47.7% |
| Immigrants | Syria | 17.4 /100 | #207 | Poor 47.8% |
| Immigrants | Senegal | 16.9 /100 | #208 | Poor 47.8% |
| Immigrants | Indonesia | 14.2 /100 | #209 | Poor 47.8% |
| Vietnamese | 11.9 /100 | #210 | Poor 47.9% |
| Panamanians | 11.8 /100 | #211 | Poor 47.9% |
| Immigrants | Burma/Myanmar | 11.7 /100 | #212 | Poor 47.9% |
| Laotians | 11.5 /100 | #213 | Poor 47.9% |
| Immigrants | Barbados | 10.7 /100 | #214 | Poor 47.9% |
| Senegalese | 10.7 /100 | #215 | Poor 47.9% |
| Immigrants | Panama | 10.2 /100 | #216 | Poor 47.9% |
| Immigrants | Grenada | 9.4 /100 | #217 | Tragic 47.9% |
| Immigrants | Western Africa | 8.3 /100 | #218 | Tragic 48.0% |
| Immigrants | Western Asia | 7.5 /100 | #219 | Tragic 48.0% |
Demographics Similar to Danes by Disability Age Over 75
In terms of disability age over 75, the demographic groups most similar to Danes are Romanian (46.2%, a difference of 0.0%), Immigrants from Southern Europe (46.2%, a difference of 0.010%), Immigrants from Jordan (46.2%, a difference of 0.020%), Immigrants from Latvia (46.2%, a difference of 0.040%), and Argentinean (46.2%, a difference of 0.040%).
| Demographics | Rating | Rank | Disability Age Over 75 |
| Soviet Union | 98.8 /100 | #80 | Exceptional 46.2% |
| New Zealanders | 98.8 /100 | #81 | Exceptional 46.2% |
| Immigrants | Latvia | 98.7 /100 | #82 | Exceptional 46.2% |
| Argentineans | 98.7 /100 | #83 | Exceptional 46.2% |
| Immigrants | Jordan | 98.7 /100 | #84 | Exceptional 46.2% |
| Immigrants | Southern Europe | 98.6 /100 | #85 | Exceptional 46.2% |
| Romanians | 98.6 /100 | #86 | Exceptional 46.2% |
| Danes | 98.6 /100 | #87 | Exceptional 46.2% |
| Uruguayans | 98.4 /100 | #88 | Exceptional 46.2% |
| Immigrants | Saudi Arabia | 98.4 /100 | #89 | Exceptional 46.3% |
| Northern Europeans | 98.3 /100 | #90 | Exceptional 46.3% |
| Immigrants | Egypt | 98.3 /100 | #91 | Exceptional 46.3% |
| Germans | 98.2 /100 | #92 | Exceptional 46.3% |
| Ugandans | 98.2 /100 | #93 | Exceptional 46.3% |
| Albanians | 98.1 /100 | #94 | Exceptional 46.3% |