Immigrants from Burma/Myanmar vs Colombian Disability Age Over 75
COMPARE
Immigrants from Burma/Myanmar
Colombian
Disability Age Over 75
Disability Age Over 75 Comparison
Immigrants from Burma/Myanmar
Colombians
47.9%
DISABILITY AGE OVER 75
11.7/ 100
METRIC RATING
212th/ 347
METRIC RANK
46.7%
DISABILITY AGE OVER 75
91.3/ 100
METRIC RATING
125th/ 347
METRIC RANK
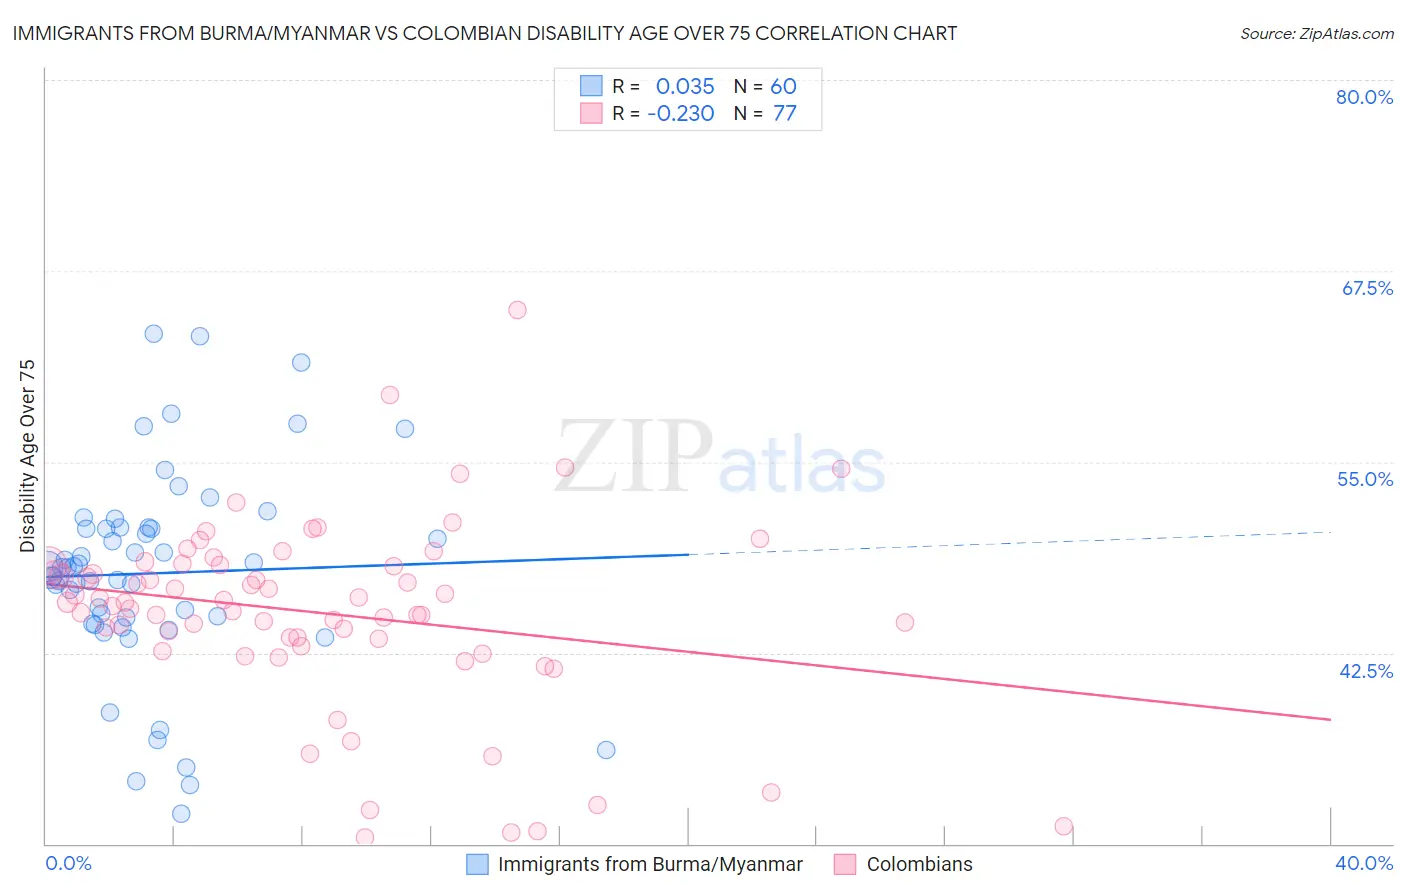
Immigrants from Burma/Myanmar vs Colombian Disability Age Over 75 Correlation Chart
The statistical analysis conducted on geographies consisting of 172,144,400 people shows no correlation between the proportion of Immigrants from Burma/Myanmar and percentage of population with a disability over the age of 75 in the United States with a correlation coefficient (R) of 0.035 and weighted average of 47.9%. Similarly, the statistical analysis conducted on geographies consisting of 418,613,267 people shows a weak negative correlation between the proportion of Colombians and percentage of population with a disability over the age of 75 in the United States with a correlation coefficient (R) of -0.230 and weighted average of 46.7%, a difference of 2.5%.
Disability Age Over 75 Correlation Summary
| Measurement | Immigrants from Burma/Myanmar | Colombian |
| Minimum | 32.0% | 30.4% |
| Maximum | 63.4% | 65.0% |
| Range | 31.4% | 34.6% |
| Mean | 47.7% | 45.1% |
| Median | 48.1% | 45.8% |
| Interquartile 25% (IQ1) | 44.6% | 43.1% |
| Interquartile 75% (IQ3) | 50.7% | 48.3% |
| Interquartile Range (IQR) | 6.1% | 5.1% |
| Standard Deviation (Sample) | 6.7% | 6.2% |
| Standard Deviation (Population) | 6.6% | 6.2% |
Similar Demographics by Disability Age Over 75
Demographics Similar to Immigrants from Burma/Myanmar by Disability Age Over 75
In terms of disability age over 75, the demographic groups most similar to Immigrants from Burma/Myanmar are Panamanian (47.9%, a difference of 0.0%), Vietnamese (47.9%, a difference of 0.010%), Laotian (47.9%, a difference of 0.010%), Immigrants from Barbados (47.9%, a difference of 0.060%), and Senegalese (47.9%, a difference of 0.060%).
| Demographics | Rating | Rank | Disability Age Over 75 |
| Immigrants | Ghana | 19.1 /100 | #205 | Poor 47.7% |
| Jamaicans | 19.0 /100 | #206 | Poor 47.7% |
| Immigrants | Syria | 17.4 /100 | #207 | Poor 47.8% |
| Immigrants | Senegal | 16.9 /100 | #208 | Poor 47.8% |
| Immigrants | Indonesia | 14.2 /100 | #209 | Poor 47.8% |
| Vietnamese | 11.9 /100 | #210 | Poor 47.9% |
| Panamanians | 11.8 /100 | #211 | Poor 47.9% |
| Immigrants | Burma/Myanmar | 11.7 /100 | #212 | Poor 47.9% |
| Laotians | 11.5 /100 | #213 | Poor 47.9% |
| Immigrants | Barbados | 10.7 /100 | #214 | Poor 47.9% |
| Senegalese | 10.7 /100 | #215 | Poor 47.9% |
| Immigrants | Panama | 10.2 /100 | #216 | Poor 47.9% |
| Immigrants | Grenada | 9.4 /100 | #217 | Tragic 47.9% |
| Immigrants | Western Africa | 8.3 /100 | #218 | Tragic 48.0% |
| Immigrants | Western Asia | 7.5 /100 | #219 | Tragic 48.0% |
Demographics Similar to Colombians by Disability Age Over 75
In terms of disability age over 75, the demographic groups most similar to Colombians are European (46.7%, a difference of 0.010%), Syrian (46.7%, a difference of 0.020%), Immigrants from South America (46.7%, a difference of 0.030%), Icelander (46.7%, a difference of 0.030%), and Immigrants from Germany (46.7%, a difference of 0.040%).
| Demographics | Rating | Rank | Disability Age Over 75 |
| Czechoslovakians | 94.7 /100 | #118 | Exceptional 46.6% |
| Canadians | 94.4 /100 | #119 | Exceptional 46.6% |
| Immigrants | Nepal | 94.1 /100 | #120 | Exceptional 46.6% |
| Scandinavians | 93.6 /100 | #121 | Exceptional 46.6% |
| Immigrants | Albania | 93.2 /100 | #122 | Exceptional 46.6% |
| Immigrants | Colombia | 92.6 /100 | #123 | Exceptional 46.7% |
| Immigrants | South America | 91.8 /100 | #124 | Exceptional 46.7% |
| Colombians | 91.3 /100 | #125 | Exceptional 46.7% |
| Europeans | 91.2 /100 | #126 | Exceptional 46.7% |
| Syrians | 91.1 /100 | #127 | Exceptional 46.7% |
| Icelanders | 90.9 /100 | #128 | Exceptional 46.7% |
| Immigrants | Germany | 90.8 /100 | #129 | Exceptional 46.7% |
| Immigrants | Northern Africa | 90.7 /100 | #130 | Exceptional 46.7% |
| Scottish | 90.5 /100 | #131 | Exceptional 46.7% |
| South Americans | 90.0 /100 | #132 | Excellent 46.8% |