Immigrants from Burma/Myanmar vs Iranian Disability Age Over 75
COMPARE
Immigrants from Burma/Myanmar
Iranian
Disability Age Over 75
Disability Age Over 75 Comparison
Immigrants from Burma/Myanmar
Iranians
47.9%
DISABILITY AGE OVER 75
11.7/ 100
METRIC RATING
212th/ 347
METRIC RANK
45.9%
DISABILITY AGE OVER 75
99.6/ 100
METRIC RATING
59th/ 347
METRIC RANK
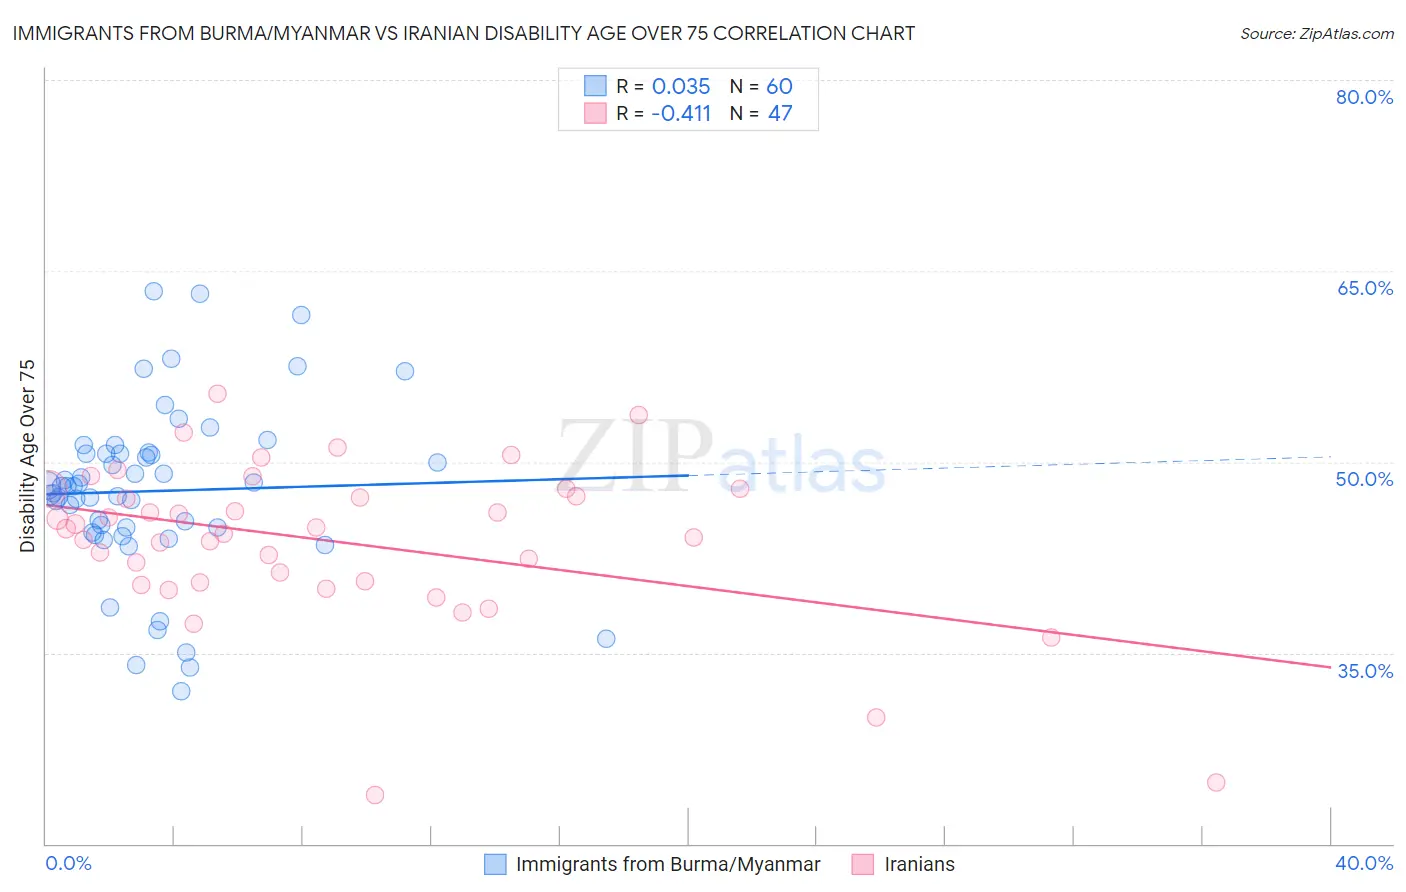
Immigrants from Burma/Myanmar vs Iranian Disability Age Over 75 Correlation Chart
The statistical analysis conducted on geographies consisting of 172,144,400 people shows no correlation between the proportion of Immigrants from Burma/Myanmar and percentage of population with a disability over the age of 75 in the United States with a correlation coefficient (R) of 0.035 and weighted average of 47.9%. Similarly, the statistical analysis conducted on geographies consisting of 316,376,826 people shows a moderate negative correlation between the proportion of Iranians and percentage of population with a disability over the age of 75 in the United States with a correlation coefficient (R) of -0.411 and weighted average of 45.9%, a difference of 4.3%.
Disability Age Over 75 Correlation Summary
| Measurement | Immigrants from Burma/Myanmar | Iranian |
| Minimum | 32.0% | 23.8% |
| Maximum | 63.4% | 55.3% |
| Range | 31.4% | 31.5% |
| Mean | 47.7% | 43.7% |
| Median | 48.1% | 44.7% |
| Interquartile 25% (IQ1) | 44.6% | 40.5% |
| Interquartile 75% (IQ3) | 50.7% | 47.9% |
| Interquartile Range (IQR) | 6.1% | 7.3% |
| Standard Deviation (Sample) | 6.7% | 6.4% |
| Standard Deviation (Population) | 6.6% | 6.3% |
Similar Demographics by Disability Age Over 75
Demographics Similar to Immigrants from Burma/Myanmar by Disability Age Over 75
In terms of disability age over 75, the demographic groups most similar to Immigrants from Burma/Myanmar are Panamanian (47.9%, a difference of 0.0%), Vietnamese (47.9%, a difference of 0.010%), Laotian (47.9%, a difference of 0.010%), Immigrants from Barbados (47.9%, a difference of 0.060%), and Senegalese (47.9%, a difference of 0.060%).
| Demographics | Rating | Rank | Disability Age Over 75 |
| Immigrants | Ghana | 19.1 /100 | #205 | Poor 47.7% |
| Jamaicans | 19.0 /100 | #206 | Poor 47.7% |
| Immigrants | Syria | 17.4 /100 | #207 | Poor 47.8% |
| Immigrants | Senegal | 16.9 /100 | #208 | Poor 47.8% |
| Immigrants | Indonesia | 14.2 /100 | #209 | Poor 47.8% |
| Vietnamese | 11.9 /100 | #210 | Poor 47.9% |
| Panamanians | 11.8 /100 | #211 | Poor 47.9% |
| Immigrants | Burma/Myanmar | 11.7 /100 | #212 | Poor 47.9% |
| Laotians | 11.5 /100 | #213 | Poor 47.9% |
| Immigrants | Barbados | 10.7 /100 | #214 | Poor 47.9% |
| Senegalese | 10.7 /100 | #215 | Poor 47.9% |
| Immigrants | Panama | 10.2 /100 | #216 | Poor 47.9% |
| Immigrants | Grenada | 9.4 /100 | #217 | Tragic 47.9% |
| Immigrants | Western Africa | 8.3 /100 | #218 | Tragic 48.0% |
| Immigrants | Western Asia | 7.5 /100 | #219 | Tragic 48.0% |
Demographics Similar to Iranians by Disability Age Over 75
In terms of disability age over 75, the demographic groups most similar to Iranians are Immigrants from Europe (45.9%, a difference of 0.0%), Immigrants from Turkey (45.9%, a difference of 0.010%), Immigrants from Israel (45.9%, a difference of 0.010%), Immigrants from Netherlands (45.9%, a difference of 0.020%), and Immigrants from Argentina (45.9%, a difference of 0.020%).
| Demographics | Rating | Rank | Disability Age Over 75 |
| Immigrants | France | 99.7 /100 | #52 | Exceptional 45.8% |
| Immigrants | Italy | 99.7 /100 | #53 | Exceptional 45.8% |
| Slovaks | 99.6 /100 | #54 | Exceptional 45.8% |
| Maltese | 99.6 /100 | #55 | Exceptional 45.8% |
| Immigrants | Netherlands | 99.6 /100 | #56 | Exceptional 45.9% |
| Immigrants | Turkey | 99.6 /100 | #57 | Exceptional 45.9% |
| Immigrants | Israel | 99.6 /100 | #58 | Exceptional 45.9% |
| Iranians | 99.6 /100 | #59 | Exceptional 45.9% |
| Immigrants | Europe | 99.6 /100 | #60 | Exceptional 45.9% |
| Immigrants | Argentina | 99.6 /100 | #61 | Exceptional 45.9% |
| Burmese | 99.5 /100 | #62 | Exceptional 45.9% |
| Immigrants | Norway | 99.5 /100 | #63 | Exceptional 45.9% |
| Immigrants | North Macedonia | 99.5 /100 | #64 | Exceptional 45.9% |
| Austrians | 99.5 /100 | #65 | Exceptional 46.0% |
| Immigrants | England | 99.5 /100 | #66 | Exceptional 46.0% |