Immigrants from Burma/Myanmar vs Luxembourger Disability Age Over 75
COMPARE
Immigrants from Burma/Myanmar
Luxembourger
Disability Age Over 75
Disability Age Over 75 Comparison
Immigrants from Burma/Myanmar
Luxembourgers
47.9%
DISABILITY AGE OVER 75
11.7/ 100
METRIC RATING
212th/ 347
METRIC RANK
44.8%
DISABILITY AGE OVER 75
100.0/ 100
METRIC RATING
5th/ 347
METRIC RANK
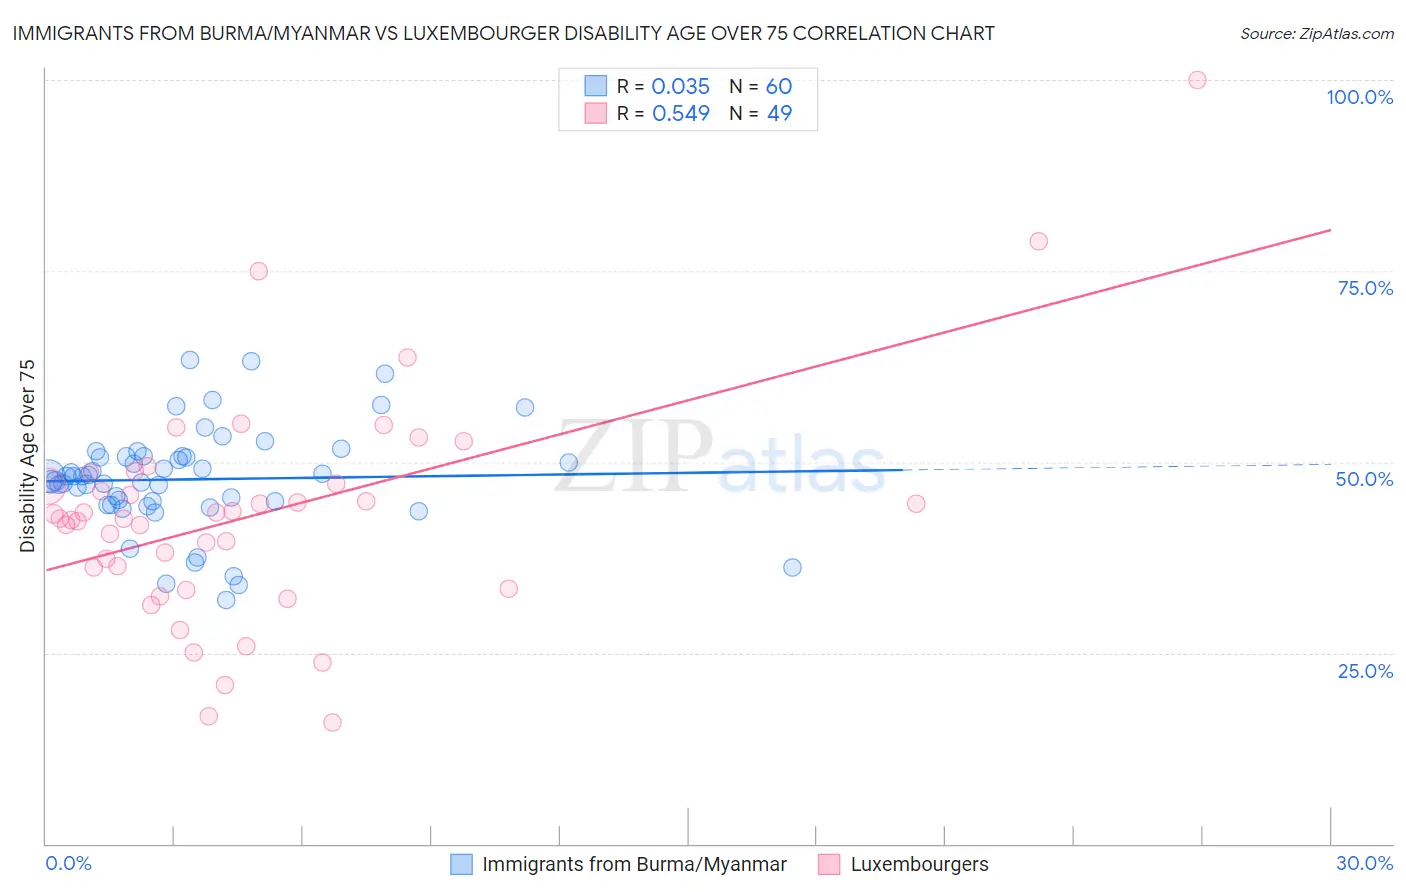
Immigrants from Burma/Myanmar vs Luxembourger Disability Age Over 75 Correlation Chart
The statistical analysis conducted on geographies consisting of 172,144,400 people shows no correlation between the proportion of Immigrants from Burma/Myanmar and percentage of population with a disability over the age of 75 in the United States with a correlation coefficient (R) of 0.035 and weighted average of 47.9%. Similarly, the statistical analysis conducted on geographies consisting of 144,572,010 people shows a substantial positive correlation between the proportion of Luxembourgers and percentage of population with a disability over the age of 75 in the United States with a correlation coefficient (R) of 0.549 and weighted average of 44.8%, a difference of 6.8%.
Disability Age Over 75 Correlation Summary
| Measurement | Immigrants from Burma/Myanmar | Luxembourger |
| Minimum | 32.0% | 15.9% |
| Maximum | 63.4% | 100.0% |
| Range | 31.4% | 84.1% |
| Mean | 47.7% | 43.1% |
| Median | 48.1% | 42.5% |
| Interquartile 25% (IQ1) | 44.6% | 34.8% |
| Interquartile 75% (IQ3) | 50.7% | 47.9% |
| Interquartile Range (IQR) | 6.1% | 13.1% |
| Standard Deviation (Sample) | 6.7% | 14.9% |
| Standard Deviation (Population) | 6.6% | 14.7% |
Similar Demographics by Disability Age Over 75
Demographics Similar to Immigrants from Burma/Myanmar by Disability Age Over 75
In terms of disability age over 75, the demographic groups most similar to Immigrants from Burma/Myanmar are Panamanian (47.9%, a difference of 0.0%), Vietnamese (47.9%, a difference of 0.010%), Laotian (47.9%, a difference of 0.010%), Immigrants from Barbados (47.9%, a difference of 0.060%), and Senegalese (47.9%, a difference of 0.060%).
| Demographics | Rating | Rank | Disability Age Over 75 |
| Immigrants | Ghana | 19.1 /100 | #205 | Poor 47.7% |
| Jamaicans | 19.0 /100 | #206 | Poor 47.7% |
| Immigrants | Syria | 17.4 /100 | #207 | Poor 47.8% |
| Immigrants | Senegal | 16.9 /100 | #208 | Poor 47.8% |
| Immigrants | Indonesia | 14.2 /100 | #209 | Poor 47.8% |
| Vietnamese | 11.9 /100 | #210 | Poor 47.9% |
| Panamanians | 11.8 /100 | #211 | Poor 47.9% |
| Immigrants | Burma/Myanmar | 11.7 /100 | #212 | Poor 47.9% |
| Laotians | 11.5 /100 | #213 | Poor 47.9% |
| Immigrants | Barbados | 10.7 /100 | #214 | Poor 47.9% |
| Senegalese | 10.7 /100 | #215 | Poor 47.9% |
| Immigrants | Panama | 10.2 /100 | #216 | Poor 47.9% |
| Immigrants | Grenada | 9.4 /100 | #217 | Tragic 47.9% |
| Immigrants | Western Africa | 8.3 /100 | #218 | Tragic 48.0% |
| Immigrants | Western Asia | 7.5 /100 | #219 | Tragic 48.0% |
Demographics Similar to Luxembourgers by Disability Age Over 75
In terms of disability age over 75, the demographic groups most similar to Luxembourgers are Carpatho Rusyn (44.8%, a difference of 0.060%), Eastern European (44.8%, a difference of 0.090%), Immigrants from Lithuania (44.9%, a difference of 0.090%), Okinawan (44.9%, a difference of 0.13%), and Immigrants from Austria (44.9%, a difference of 0.25%).
| Demographics | Rating | Rank | Disability Age Over 75 |
| Cypriots | 100.0 /100 | #1 | Exceptional 43.5% |
| Immigrants | Ireland | 100.0 /100 | #2 | Exceptional 44.7% |
| Eastern Europeans | 100.0 /100 | #3 | Exceptional 44.8% |
| Carpatho Rusyns | 100.0 /100 | #4 | Exceptional 44.8% |
| Luxembourgers | 100.0 /100 | #5 | Exceptional 44.8% |
| Immigrants | Lithuania | 100.0 /100 | #6 | Exceptional 44.9% |
| Okinawans | 100.0 /100 | #7 | Exceptional 44.9% |
| Immigrants | Austria | 100.0 /100 | #8 | Exceptional 44.9% |
| Paraguayans | 100.0 /100 | #9 | Exceptional 45.0% |
| Bulgarians | 100.0 /100 | #10 | Exceptional 45.1% |
| Lithuanians | 100.0 /100 | #11 | Exceptional 45.1% |
| Immigrants | Czechoslovakia | 100.0 /100 | #12 | Exceptional 45.1% |
| Latvians | 100.0 /100 | #13 | Exceptional 45.1% |
| Immigrants | Scotland | 100.0 /100 | #14 | Exceptional 45.1% |
| Immigrants | Sweden | 100.0 /100 | #15 | Exceptional 45.1% |