Immigrants from Burma/Myanmar vs Croatian Disability Age Over 75
COMPARE
Immigrants from Burma/Myanmar
Croatian
Disability Age Over 75
Disability Age Over 75 Comparison
Immigrants from Burma/Myanmar
Croatians
47.9%
DISABILITY AGE OVER 75
11.7/ 100
METRIC RATING
212th/ 347
METRIC RANK
45.7%
DISABILITY AGE OVER 75
99.8/ 100
METRIC RATING
48th/ 347
METRIC RANK
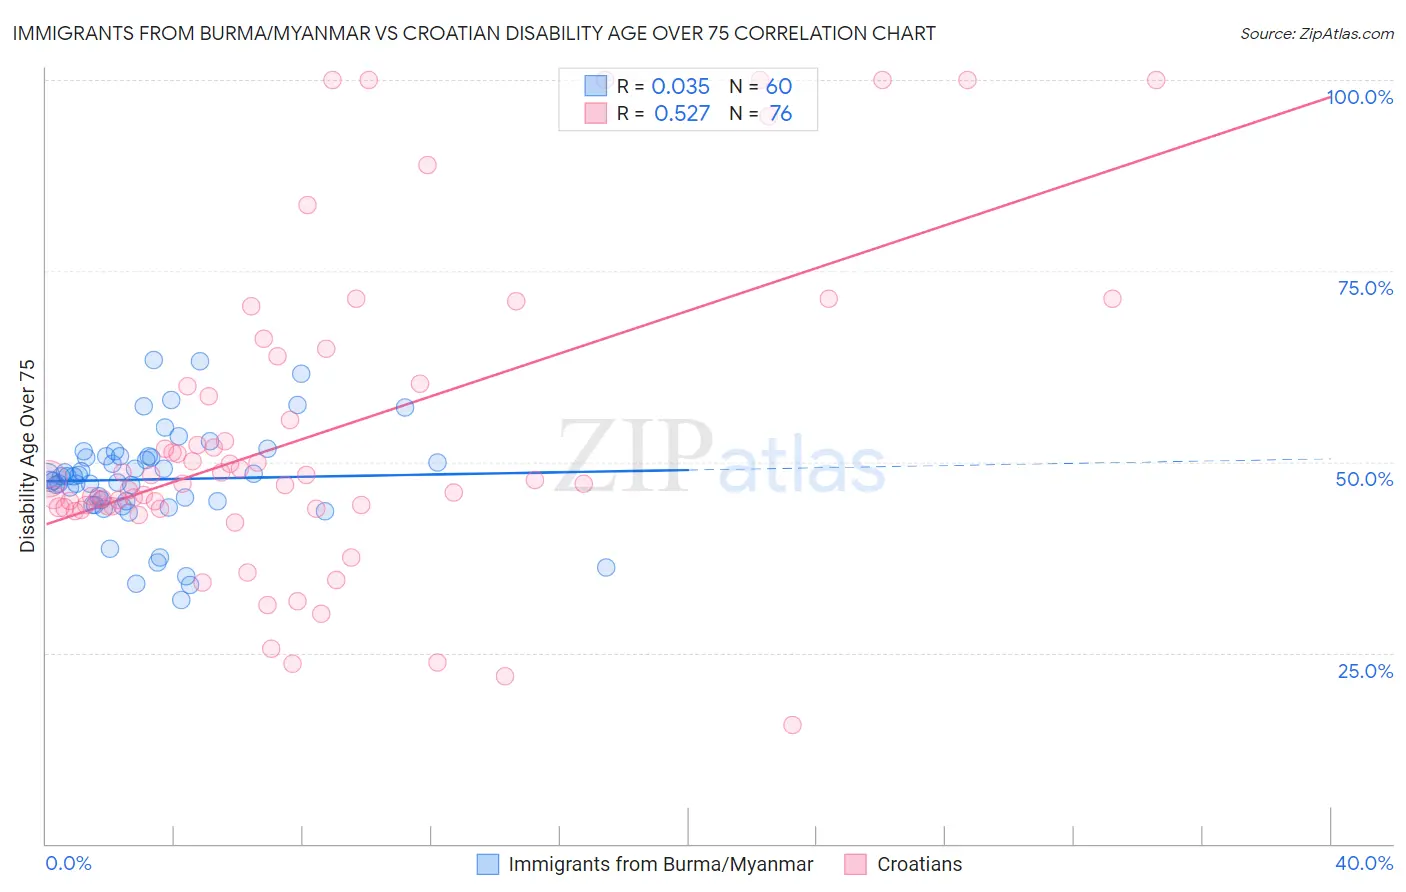
Immigrants from Burma/Myanmar vs Croatian Disability Age Over 75 Correlation Chart
The statistical analysis conducted on geographies consisting of 172,144,400 people shows no correlation between the proportion of Immigrants from Burma/Myanmar and percentage of population with a disability over the age of 75 in the United States with a correlation coefficient (R) of 0.035 and weighted average of 47.9%. Similarly, the statistical analysis conducted on geographies consisting of 375,275,816 people shows a substantial positive correlation between the proportion of Croatians and percentage of population with a disability over the age of 75 in the United States with a correlation coefficient (R) of 0.527 and weighted average of 45.7%, a difference of 4.8%.
Disability Age Over 75 Correlation Summary
| Measurement | Immigrants from Burma/Myanmar | Croatian |
| Minimum | 32.0% | 15.6% |
| Maximum | 63.4% | 100.0% |
| Range | 31.4% | 84.4% |
| Mean | 47.7% | 53.4% |
| Median | 48.1% | 47.4% |
| Interquartile 25% (IQ1) | 44.6% | 44.0% |
| Interquartile 75% (IQ3) | 50.7% | 60.1% |
| Interquartile Range (IQR) | 6.1% | 16.0% |
| Standard Deviation (Sample) | 6.7% | 20.4% |
| Standard Deviation (Population) | 6.6% | 20.2% |
Similar Demographics by Disability Age Over 75
Demographics Similar to Immigrants from Burma/Myanmar by Disability Age Over 75
In terms of disability age over 75, the demographic groups most similar to Immigrants from Burma/Myanmar are Panamanian (47.9%, a difference of 0.0%), Vietnamese (47.9%, a difference of 0.010%), Laotian (47.9%, a difference of 0.010%), Immigrants from Barbados (47.9%, a difference of 0.060%), and Senegalese (47.9%, a difference of 0.060%).
| Demographics | Rating | Rank | Disability Age Over 75 |
| Immigrants | Ghana | 19.1 /100 | #205 | Poor 47.7% |
| Jamaicans | 19.0 /100 | #206 | Poor 47.7% |
| Immigrants | Syria | 17.4 /100 | #207 | Poor 47.8% |
| Immigrants | Senegal | 16.9 /100 | #208 | Poor 47.8% |
| Immigrants | Indonesia | 14.2 /100 | #209 | Poor 47.8% |
| Vietnamese | 11.9 /100 | #210 | Poor 47.9% |
| Panamanians | 11.8 /100 | #211 | Poor 47.9% |
| Immigrants | Burma/Myanmar | 11.7 /100 | #212 | Poor 47.9% |
| Laotians | 11.5 /100 | #213 | Poor 47.9% |
| Immigrants | Barbados | 10.7 /100 | #214 | Poor 47.9% |
| Senegalese | 10.7 /100 | #215 | Poor 47.9% |
| Immigrants | Panama | 10.2 /100 | #216 | Poor 47.9% |
| Immigrants | Grenada | 9.4 /100 | #217 | Tragic 47.9% |
| Immigrants | Western Africa | 8.3 /100 | #218 | Tragic 48.0% |
| Immigrants | Western Asia | 7.5 /100 | #219 | Tragic 48.0% |
Demographics Similar to Croatians by Disability Age Over 75
In terms of disability age over 75, the demographic groups most similar to Croatians are Immigrants from Canada (45.7%, a difference of 0.010%), Swedish (45.7%, a difference of 0.020%), Australian (45.7%, a difference of 0.050%), Turkish (45.7%, a difference of 0.050%), and Immigrants from North America (45.7%, a difference of 0.070%).
| Demographics | Rating | Rank | Disability Age Over 75 |
| Immigrants | Singapore | 99.8 /100 | #41 | Exceptional 45.6% |
| Greeks | 99.8 /100 | #42 | Exceptional 45.6% |
| Czechs | 99.8 /100 | #43 | Exceptional 45.7% |
| Australians | 99.8 /100 | #44 | Exceptional 45.7% |
| Turks | 99.8 /100 | #45 | Exceptional 45.7% |
| Swedes | 99.8 /100 | #46 | Exceptional 45.7% |
| Immigrants | Canada | 99.8 /100 | #47 | Exceptional 45.7% |
| Croatians | 99.8 /100 | #48 | Exceptional 45.7% |
| Immigrants | North America | 99.8 /100 | #49 | Exceptional 45.7% |
| Belgians | 99.7 /100 | #50 | Exceptional 45.8% |
| Immigrants | Korea | 99.7 /100 | #51 | Exceptional 45.8% |
| Immigrants | France | 99.7 /100 | #52 | Exceptional 45.8% |
| Immigrants | Italy | 99.7 /100 | #53 | Exceptional 45.8% |
| Slovaks | 99.6 /100 | #54 | Exceptional 45.8% |
| Maltese | 99.6 /100 | #55 | Exceptional 45.8% |