Immigrants from Burma/Myanmar vs Choctaw Disability Age Over 75
COMPARE
Immigrants from Burma/Myanmar
Choctaw
Disability Age Over 75
Disability Age Over 75 Comparison
Immigrants from Burma/Myanmar
Choctaw
47.9%
DISABILITY AGE OVER 75
11.7/ 100
METRIC RATING
212th/ 347
METRIC RANK
52.7%
DISABILITY AGE OVER 75
0.0/ 100
METRIC RATING
328th/ 347
METRIC RANK
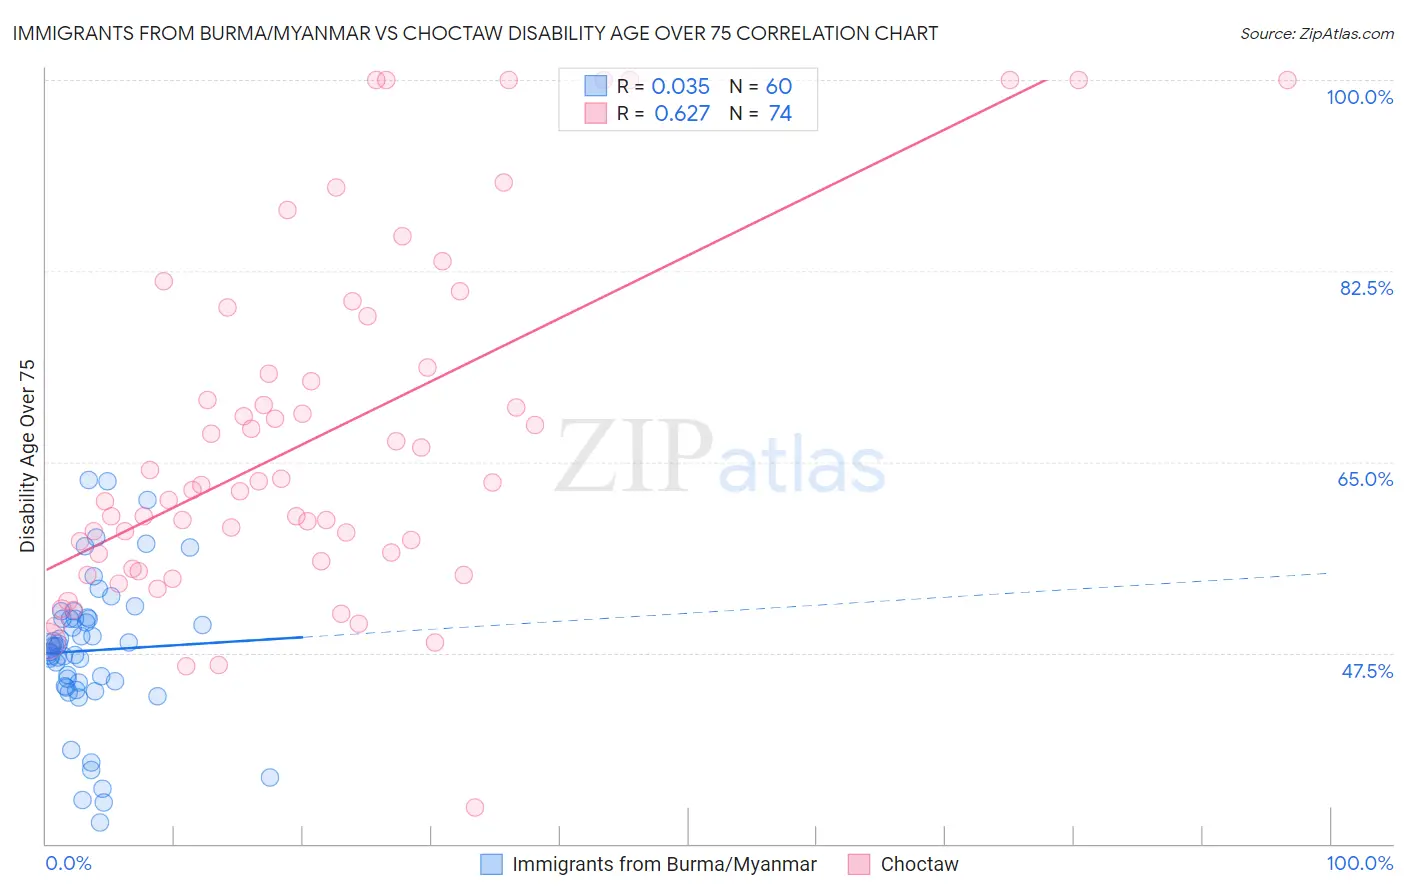
Immigrants from Burma/Myanmar vs Choctaw Disability Age Over 75 Correlation Chart
The statistical analysis conducted on geographies consisting of 172,144,400 people shows no correlation between the proportion of Immigrants from Burma/Myanmar and percentage of population with a disability over the age of 75 in the United States with a correlation coefficient (R) of 0.035 and weighted average of 47.9%. Similarly, the statistical analysis conducted on geographies consisting of 269,353,034 people shows a significant positive correlation between the proportion of Choctaw and percentage of population with a disability over the age of 75 in the United States with a correlation coefficient (R) of 0.627 and weighted average of 52.7%, a difference of 10.0%.
Disability Age Over 75 Correlation Summary
| Measurement | Immigrants from Burma/Myanmar | Choctaw |
| Minimum | 32.0% | 33.3% |
| Maximum | 63.4% | 100.0% |
| Range | 31.4% | 66.7% |
| Mean | 47.7% | 67.1% |
| Median | 48.1% | 62.6% |
| Interquartile 25% (IQ1) | 44.6% | 55.9% |
| Interquartile 75% (IQ3) | 50.7% | 73.7% |
| Interquartile Range (IQR) | 6.1% | 17.8% |
| Standard Deviation (Sample) | 6.7% | 15.9% |
| Standard Deviation (Population) | 6.6% | 15.8% |
Similar Demographics by Disability Age Over 75
Demographics Similar to Immigrants from Burma/Myanmar by Disability Age Over 75
In terms of disability age over 75, the demographic groups most similar to Immigrants from Burma/Myanmar are Panamanian (47.9%, a difference of 0.0%), Vietnamese (47.9%, a difference of 0.010%), Laotian (47.9%, a difference of 0.010%), Immigrants from Barbados (47.9%, a difference of 0.060%), and Senegalese (47.9%, a difference of 0.060%).
| Demographics | Rating | Rank | Disability Age Over 75 |
| Immigrants | Ghana | 19.1 /100 | #205 | Poor 47.7% |
| Jamaicans | 19.0 /100 | #206 | Poor 47.7% |
| Immigrants | Syria | 17.4 /100 | #207 | Poor 47.8% |
| Immigrants | Senegal | 16.9 /100 | #208 | Poor 47.8% |
| Immigrants | Indonesia | 14.2 /100 | #209 | Poor 47.8% |
| Vietnamese | 11.9 /100 | #210 | Poor 47.9% |
| Panamanians | 11.8 /100 | #211 | Poor 47.9% |
| Immigrants | Burma/Myanmar | 11.7 /100 | #212 | Poor 47.9% |
| Laotians | 11.5 /100 | #213 | Poor 47.9% |
| Immigrants | Barbados | 10.7 /100 | #214 | Poor 47.9% |
| Senegalese | 10.7 /100 | #215 | Poor 47.9% |
| Immigrants | Panama | 10.2 /100 | #216 | Poor 47.9% |
| Immigrants | Grenada | 9.4 /100 | #217 | Tragic 47.9% |
| Immigrants | Western Africa | 8.3 /100 | #218 | Tragic 48.0% |
| Immigrants | Western Asia | 7.5 /100 | #219 | Tragic 48.0% |
Demographics Similar to Choctaw by Disability Age Over 75
In terms of disability age over 75, the demographic groups most similar to Choctaw are Nepalese (52.6%, a difference of 0.19%), Ute (52.6%, a difference of 0.22%), Alaska Native (52.8%, a difference of 0.22%), Puerto Rican (52.9%, a difference of 0.39%), and Hopi (52.9%, a difference of 0.41%).
| Demographics | Rating | Rank | Disability Age Over 75 |
| Dutch West Indians | 0.0 /100 | #321 | Tragic 51.5% |
| Comanche | 0.0 /100 | #322 | Tragic 51.7% |
| Immigrants | Yemen | 0.0 /100 | #323 | Tragic 52.0% |
| Menominee | 0.0 /100 | #324 | Tragic 52.3% |
| Immigrants | Cabo Verde | 0.0 /100 | #325 | Tragic 52.4% |
| Ute | 0.0 /100 | #326 | Tragic 52.6% |
| Nepalese | 0.0 /100 | #327 | Tragic 52.6% |
| Choctaw | 0.0 /100 | #328 | Tragic 52.7% |
| Alaska Natives | 0.0 /100 | #329 | Tragic 52.8% |
| Puerto Ricans | 0.0 /100 | #330 | Tragic 52.9% |
| Hopi | 0.0 /100 | #331 | Tragic 52.9% |
| Natives/Alaskans | 0.0 /100 | #332 | Tragic 53.1% |
| Apache | 0.0 /100 | #333 | Tragic 53.6% |
| Alaskan Athabascans | 0.0 /100 | #334 | Tragic 54.0% |
| Kiowa | 0.0 /100 | #335 | Tragic 54.2% |