Immigrants from Burma/Myanmar vs Immigrants from Lebanon Disability Age Over 75
COMPARE
Immigrants from Burma/Myanmar
Immigrants from Lebanon
Disability Age Over 75
Disability Age Over 75 Comparison
Immigrants from Burma/Myanmar
Immigrants from Lebanon
47.9%
DISABILITY AGE OVER 75
11.7/ 100
METRIC RATING
212th/ 347
METRIC RANK
47.6%
DISABILITY AGE OVER 75
26.5/ 100
METRIC RATING
194th/ 347
METRIC RANK
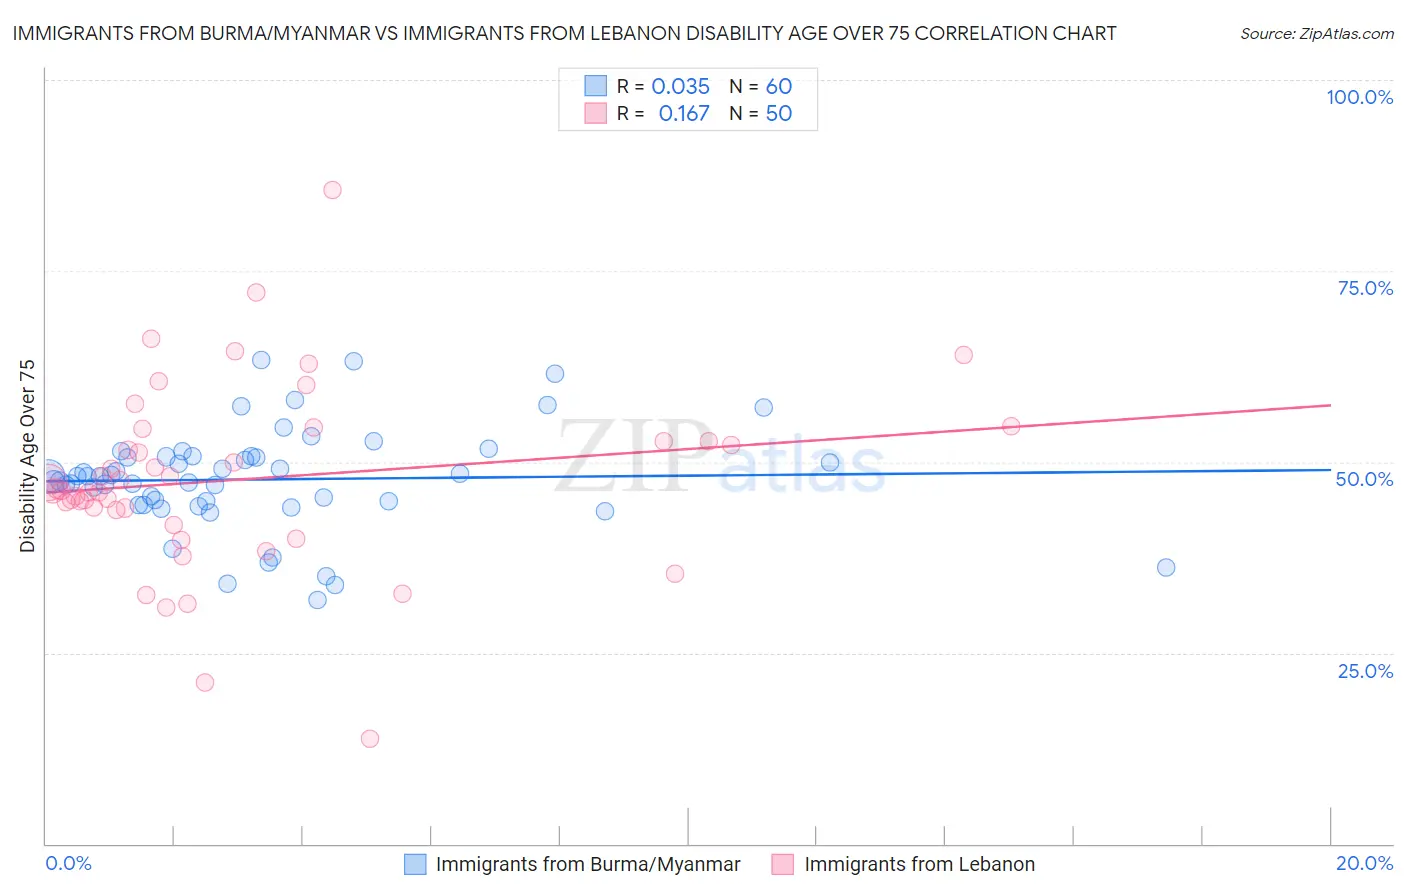
Immigrants from Burma/Myanmar vs Immigrants from Lebanon Disability Age Over 75 Correlation Chart
The statistical analysis conducted on geographies consisting of 172,144,400 people shows no correlation between the proportion of Immigrants from Burma/Myanmar and percentage of population with a disability over the age of 75 in the United States with a correlation coefficient (R) of 0.035 and weighted average of 47.9%. Similarly, the statistical analysis conducted on geographies consisting of 217,096,907 people shows a poor positive correlation between the proportion of Immigrants from Lebanon and percentage of population with a disability over the age of 75 in the United States with a correlation coefficient (R) of 0.167 and weighted average of 47.6%, a difference of 0.56%.
Disability Age Over 75 Correlation Summary
| Measurement | Immigrants from Burma/Myanmar | Immigrants from Lebanon |
| Minimum | 32.0% | 13.8% |
| Maximum | 63.4% | 85.5% |
| Range | 31.4% | 71.8% |
| Mean | 47.7% | 47.7% |
| Median | 48.1% | 46.4% |
| Interquartile 25% (IQ1) | 44.6% | 43.7% |
| Interquartile 75% (IQ3) | 50.7% | 52.7% |
| Interquartile Range (IQR) | 6.1% | 9.1% |
| Standard Deviation (Sample) | 6.7% | 12.2% |
| Standard Deviation (Population) | 6.6% | 12.1% |
Demographics Similar to Immigrants from Burma/Myanmar and Immigrants from Lebanon by Disability Age Over 75
In terms of disability age over 75, the demographic groups most similar to Immigrants from Burma/Myanmar are Panamanian (47.9%, a difference of 0.0%), Vietnamese (47.9%, a difference of 0.010%), Laotian (47.9%, a difference of 0.010%), Immigrants from Indonesia (47.8%, a difference of 0.12%), and Immigrants from Senegal (47.8%, a difference of 0.24%). Similarly, the demographic groups most similar to Immigrants from Lebanon are Immigrants from Trinidad and Tobago (47.6%, a difference of 0.030%), Ottawa (47.6%, a difference of 0.050%), Immigrants from Portugal (47.6%, a difference of 0.080%), Pakistani (47.7%, a difference of 0.090%), and Immigrants from Ukraine (47.7%, a difference of 0.10%).
| Demographics | Rating | Rank | Disability Age Over 75 |
| Ottawa | 28.1 /100 | #193 | Fair 47.6% |
| Immigrants | Lebanon | 26.5 /100 | #194 | Fair 47.6% |
| Immigrants | Trinidad and Tobago | 25.3 /100 | #195 | Fair 47.6% |
| Immigrants | Portugal | 23.8 /100 | #196 | Fair 47.6% |
| Pakistanis | 23.4 /100 | #197 | Fair 47.7% |
| Immigrants | Ukraine | 23.2 /100 | #198 | Fair 47.7% |
| Immigrants | Eritrea | 22.4 /100 | #199 | Fair 47.7% |
| Immigrants | Somalia | 21.4 /100 | #200 | Fair 47.7% |
| Immigrants | Cuba | 20.9 /100 | #201 | Fair 47.7% |
| Immigrants | Bahamas | 20.7 /100 | #202 | Fair 47.7% |
| Trinidadians and Tobagonians | 20.0 /100 | #203 | Fair 47.7% |
| Nigerians | 19.2 /100 | #204 | Poor 47.7% |
| Immigrants | Ghana | 19.1 /100 | #205 | Poor 47.7% |
| Jamaicans | 19.0 /100 | #206 | Poor 47.7% |
| Immigrants | Syria | 17.4 /100 | #207 | Poor 47.8% |
| Immigrants | Senegal | 16.9 /100 | #208 | Poor 47.8% |
| Immigrants | Indonesia | 14.2 /100 | #209 | Poor 47.8% |
| Vietnamese | 11.9 /100 | #210 | Poor 47.9% |
| Panamanians | 11.8 /100 | #211 | Poor 47.9% |
| Immigrants | Burma/Myanmar | 11.7 /100 | #212 | Poor 47.9% |
| Laotians | 11.5 /100 | #213 | Poor 47.9% |