Immigrants from Burma/Myanmar vs Cherokee Disability Age Over 75
COMPARE
Immigrants from Burma/Myanmar
Cherokee
Disability Age Over 75
Disability Age Over 75 Comparison
Immigrants from Burma/Myanmar
Cherokee
47.9%
DISABILITY AGE OVER 75
11.7/ 100
METRIC RATING
212th/ 347
METRIC RANK
50.2%
DISABILITY AGE OVER 75
0.0/ 100
METRIC RATING
302nd/ 347
METRIC RANK
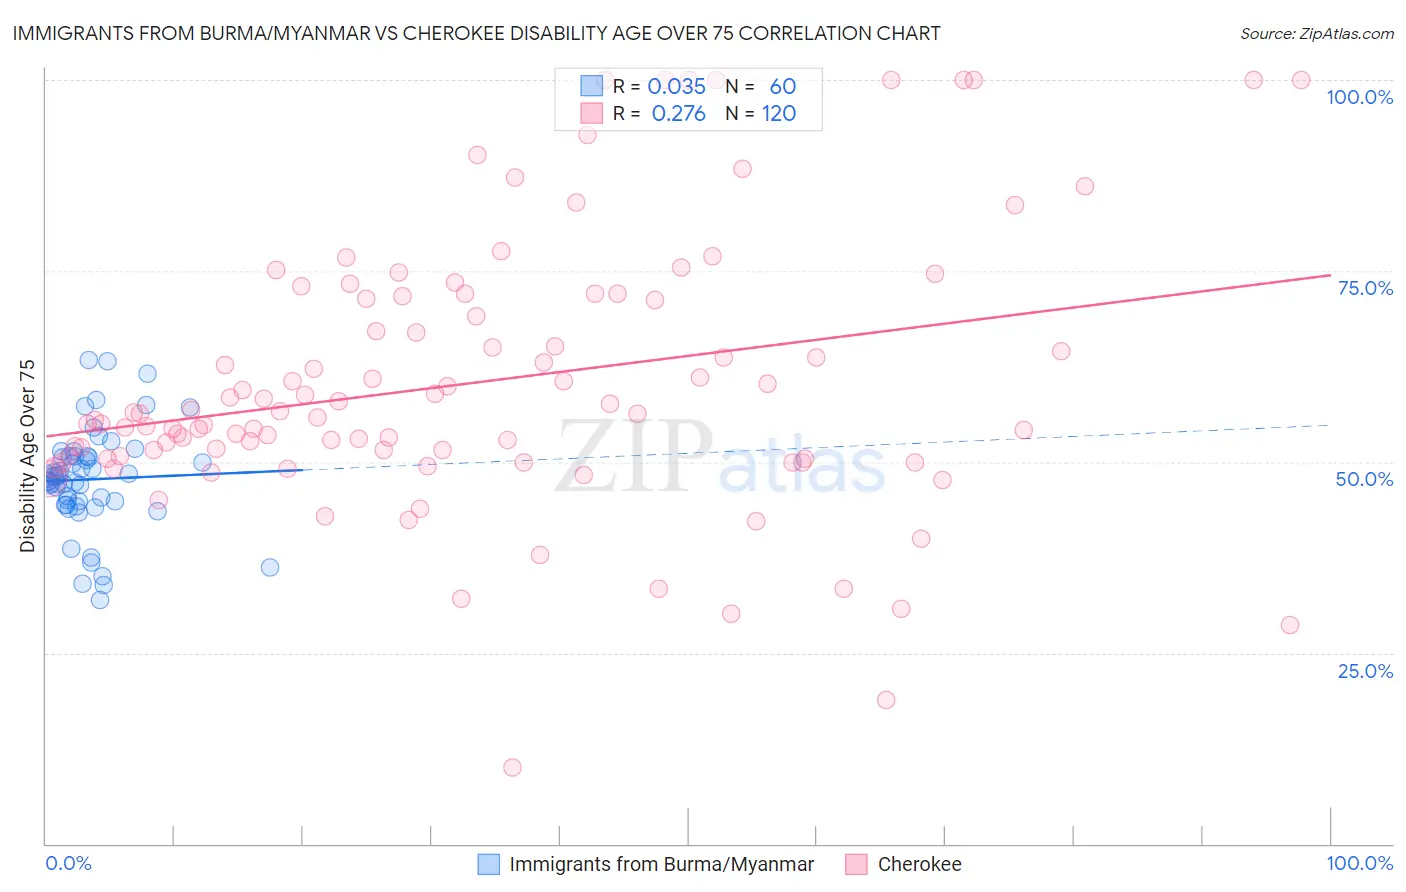
Immigrants from Burma/Myanmar vs Cherokee Disability Age Over 75 Correlation Chart
The statistical analysis conducted on geographies consisting of 172,144,400 people shows no correlation between the proportion of Immigrants from Burma/Myanmar and percentage of population with a disability over the age of 75 in the United States with a correlation coefficient (R) of 0.035 and weighted average of 47.9%. Similarly, the statistical analysis conducted on geographies consisting of 492,575,562 people shows a weak positive correlation between the proportion of Cherokee and percentage of population with a disability over the age of 75 in the United States with a correlation coefficient (R) of 0.276 and weighted average of 50.2%, a difference of 4.9%.
Disability Age Over 75 Correlation Summary
| Measurement | Immigrants from Burma/Myanmar | Cherokee |
| Minimum | 32.0% | 10.0% |
| Maximum | 63.4% | 100.0% |
| Range | 31.4% | 90.0% |
| Mean | 47.7% | 60.5% |
| Median | 48.1% | 56.3% |
| Interquartile 25% (IQ1) | 44.6% | 50.6% |
| Interquartile 75% (IQ3) | 50.7% | 71.5% |
| Interquartile Range (IQR) | 6.1% | 20.9% |
| Standard Deviation (Sample) | 6.7% | 17.8% |
| Standard Deviation (Population) | 6.6% | 17.7% |
Similar Demographics by Disability Age Over 75
Demographics Similar to Immigrants from Burma/Myanmar by Disability Age Over 75
In terms of disability age over 75, the demographic groups most similar to Immigrants from Burma/Myanmar are Panamanian (47.9%, a difference of 0.0%), Vietnamese (47.9%, a difference of 0.010%), Laotian (47.9%, a difference of 0.010%), Immigrants from Barbados (47.9%, a difference of 0.060%), and Senegalese (47.9%, a difference of 0.060%).
| Demographics | Rating | Rank | Disability Age Over 75 |
| Immigrants | Ghana | 19.1 /100 | #205 | Poor 47.7% |
| Jamaicans | 19.0 /100 | #206 | Poor 47.7% |
| Immigrants | Syria | 17.4 /100 | #207 | Poor 47.8% |
| Immigrants | Senegal | 16.9 /100 | #208 | Poor 47.8% |
| Immigrants | Indonesia | 14.2 /100 | #209 | Poor 47.8% |
| Vietnamese | 11.9 /100 | #210 | Poor 47.9% |
| Panamanians | 11.8 /100 | #211 | Poor 47.9% |
| Immigrants | Burma/Myanmar | 11.7 /100 | #212 | Poor 47.9% |
| Laotians | 11.5 /100 | #213 | Poor 47.9% |
| Immigrants | Barbados | 10.7 /100 | #214 | Poor 47.9% |
| Senegalese | 10.7 /100 | #215 | Poor 47.9% |
| Immigrants | Panama | 10.2 /100 | #216 | Poor 47.9% |
| Immigrants | Grenada | 9.4 /100 | #217 | Tragic 47.9% |
| Immigrants | Western Africa | 8.3 /100 | #218 | Tragic 48.0% |
| Immigrants | Western Asia | 7.5 /100 | #219 | Tragic 48.0% |
Demographics Similar to Cherokee by Disability Age Over 75
In terms of disability age over 75, the demographic groups most similar to Cherokee are Japanese (50.2%, a difference of 0.010%), Immigrants from Dominican Republic (50.3%, a difference of 0.12%), Dominican (50.2%, a difference of 0.15%), Cape Verdean (50.1%, a difference of 0.21%), and Immigrants from Micronesia (50.1%, a difference of 0.25%).
| Demographics | Rating | Rank | Disability Age Over 75 |
| Spanish Americans | 0.0 /100 | #295 | Tragic 50.0% |
| Mexican American Indians | 0.0 /100 | #296 | Tragic 50.0% |
| Armenians | 0.0 /100 | #297 | Tragic 50.0% |
| Marshallese | 0.0 /100 | #298 | Tragic 50.1% |
| Immigrants | Micronesia | 0.0 /100 | #299 | Tragic 50.1% |
| Cape Verdeans | 0.0 /100 | #300 | Tragic 50.1% |
| Dominicans | 0.0 /100 | #301 | Tragic 50.2% |
| Cherokee | 0.0 /100 | #302 | Tragic 50.2% |
| Japanese | 0.0 /100 | #303 | Tragic 50.2% |
| Immigrants | Dominican Republic | 0.0 /100 | #304 | Tragic 50.3% |
| Central American Indians | 0.0 /100 | #305 | Tragic 50.5% |
| Immigrants | Central America | 0.0 /100 | #306 | Tragic 50.5% |
| Immigrants | Fiji | 0.0 /100 | #307 | Tragic 50.6% |
| Hispanics or Latinos | 0.0 /100 | #308 | Tragic 50.6% |
| Aleuts | 0.0 /100 | #309 | Tragic 50.6% |