Immigrants from Burma/Myanmar vs Sudanese Disability Age Over 75
COMPARE
Immigrants from Burma/Myanmar
Sudanese
Disability Age Over 75
Disability Age Over 75 Comparison
Immigrants from Burma/Myanmar
Sudanese
47.9%
DISABILITY AGE OVER 75
11.7/ 100
METRIC RATING
212th/ 347
METRIC RANK
47.5%
DISABILITY AGE OVER 75
32.0/ 100
METRIC RATING
186th/ 347
METRIC RANK
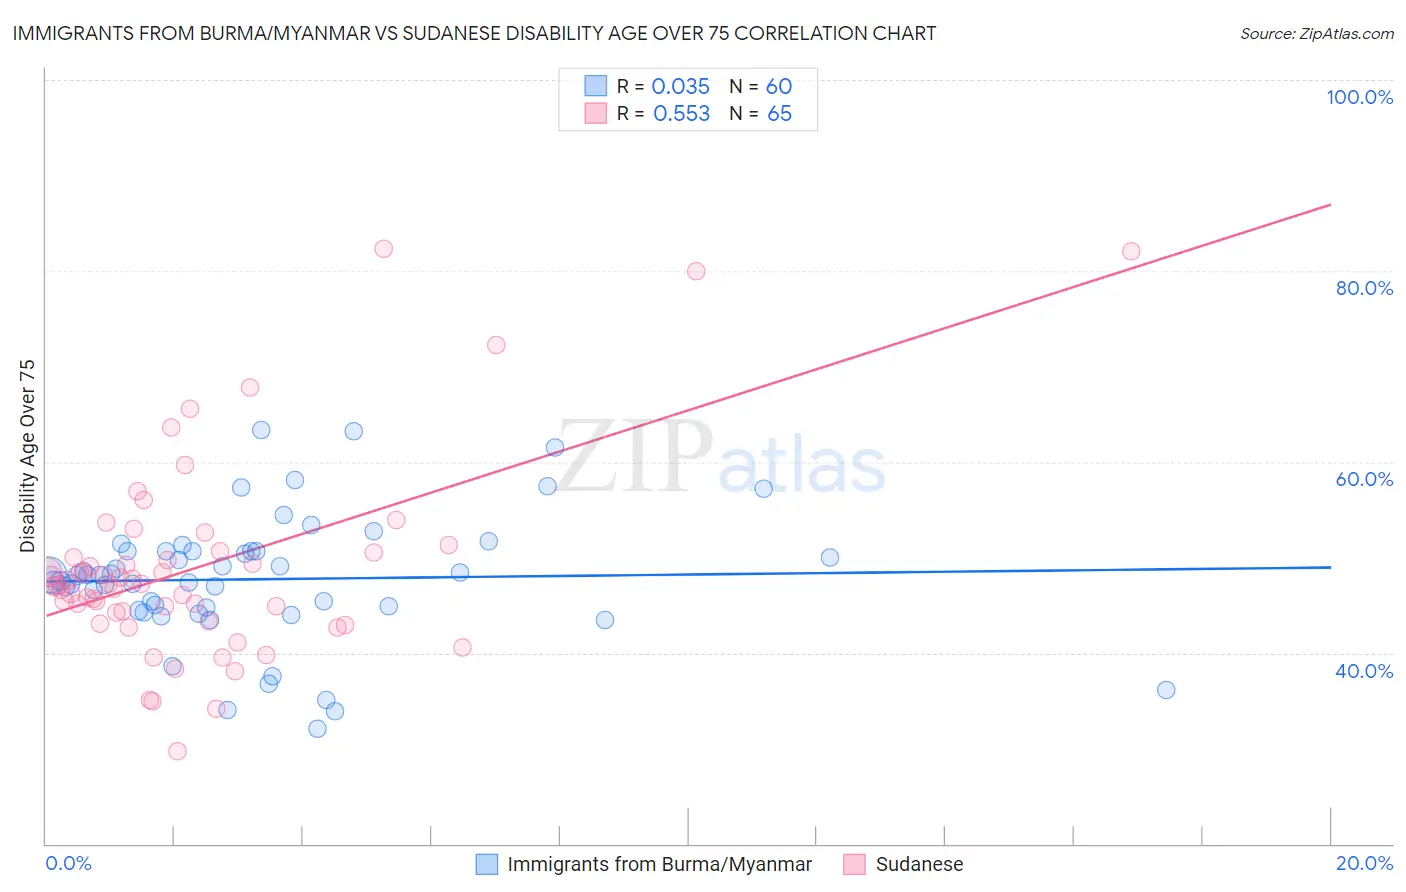
Immigrants from Burma/Myanmar vs Sudanese Disability Age Over 75 Correlation Chart
The statistical analysis conducted on geographies consisting of 172,144,400 people shows no correlation between the proportion of Immigrants from Burma/Myanmar and percentage of population with a disability over the age of 75 in the United States with a correlation coefficient (R) of 0.035 and weighted average of 47.9%. Similarly, the statistical analysis conducted on geographies consisting of 110,068,625 people shows a substantial positive correlation between the proportion of Sudanese and percentage of population with a disability over the age of 75 in the United States with a correlation coefficient (R) of 0.553 and weighted average of 47.5%, a difference of 0.71%.
Disability Age Over 75 Correlation Summary
| Measurement | Immigrants from Burma/Myanmar | Sudanese |
| Minimum | 32.0% | 29.7% |
| Maximum | 63.4% | 82.4% |
| Range | 31.4% | 52.6% |
| Mean | 47.7% | 49.0% |
| Median | 48.1% | 47.3% |
| Interquartile 25% (IQ1) | 44.6% | 43.8% |
| Interquartile 75% (IQ3) | 50.7% | 50.6% |
| Interquartile Range (IQR) | 6.1% | 6.8% |
| Standard Deviation (Sample) | 6.7% | 10.4% |
| Standard Deviation (Population) | 6.6% | 10.3% |
Similar Demographics by Disability Age Over 75
Demographics Similar to Immigrants from Burma/Myanmar by Disability Age Over 75
In terms of disability age over 75, the demographic groups most similar to Immigrants from Burma/Myanmar are Panamanian (47.9%, a difference of 0.0%), Vietnamese (47.9%, a difference of 0.010%), Laotian (47.9%, a difference of 0.010%), Immigrants from Barbados (47.9%, a difference of 0.060%), and Senegalese (47.9%, a difference of 0.060%).
| Demographics | Rating | Rank | Disability Age Over 75 |
| Immigrants | Ghana | 19.1 /100 | #205 | Poor 47.7% |
| Jamaicans | 19.0 /100 | #206 | Poor 47.7% |
| Immigrants | Syria | 17.4 /100 | #207 | Poor 47.8% |
| Immigrants | Senegal | 16.9 /100 | #208 | Poor 47.8% |
| Immigrants | Indonesia | 14.2 /100 | #209 | Poor 47.8% |
| Vietnamese | 11.9 /100 | #210 | Poor 47.9% |
| Panamanians | 11.8 /100 | #211 | Poor 47.9% |
| Immigrants | Burma/Myanmar | 11.7 /100 | #212 | Poor 47.9% |
| Laotians | 11.5 /100 | #213 | Poor 47.9% |
| Immigrants | Barbados | 10.7 /100 | #214 | Poor 47.9% |
| Senegalese | 10.7 /100 | #215 | Poor 47.9% |
| Immigrants | Panama | 10.2 /100 | #216 | Poor 47.9% |
| Immigrants | Grenada | 9.4 /100 | #217 | Tragic 47.9% |
| Immigrants | Western Africa | 8.3 /100 | #218 | Tragic 48.0% |
| Immigrants | Western Asia | 7.5 /100 | #219 | Tragic 48.0% |
Demographics Similar to Sudanese by Disability Age Over 75
In terms of disability age over 75, the demographic groups most similar to Sudanese are Immigrants from Sudan (47.5%, a difference of 0.010%), Ghanaian (47.5%, a difference of 0.030%), Basque (47.6%, a difference of 0.030%), Immigrants from Kenya (47.6%, a difference of 0.030%), and Immigrants from Nigeria (47.5%, a difference of 0.050%).
| Demographics | Rating | Rank | Disability Age Over 75 |
| Sierra Leoneans | 41.7 /100 | #179 | Average 47.4% |
| Immigrants | Ecuador | 41.7 /100 | #180 | Average 47.4% |
| Immigrants | Kazakhstan | 40.4 /100 | #181 | Average 47.4% |
| Immigrants | Moldova | 39.9 /100 | #182 | Fair 47.4% |
| Delaware | 39.1 /100 | #183 | Fair 47.5% |
| Immigrants | Nigeria | 34.0 /100 | #184 | Fair 47.5% |
| Ghanaians | 33.0 /100 | #185 | Fair 47.5% |
| Sudanese | 32.0 /100 | #186 | Fair 47.5% |
| Immigrants | Sudan | 31.8 /100 | #187 | Fair 47.5% |
| Basques | 30.9 /100 | #188 | Fair 47.6% |
| Immigrants | Kenya | 30.8 /100 | #189 | Fair 47.6% |
| Somalis | 29.5 /100 | #190 | Fair 47.6% |
| Portuguese | 29.3 /100 | #191 | Fair 47.6% |
| Immigrants | Jamaica | 28.3 /100 | #192 | Fair 47.6% |
| Ottawa | 28.1 /100 | #193 | Fair 47.6% |