Immigrants from Burma/Myanmar vs Central American Median Male Earnings
COMPARE
Immigrants from Burma/Myanmar
Central American
Median Male Earnings
Median Male Earnings Comparison
Immigrants from Burma/Myanmar
Central Americans
$50,298
MEDIAN MALE EARNINGS
1.6/ 100
METRIC RATING
249th/ 347
METRIC RANK
$48,093
MEDIAN MALE EARNINGS
0.2/ 100
METRIC RATING
282nd/ 347
METRIC RANK
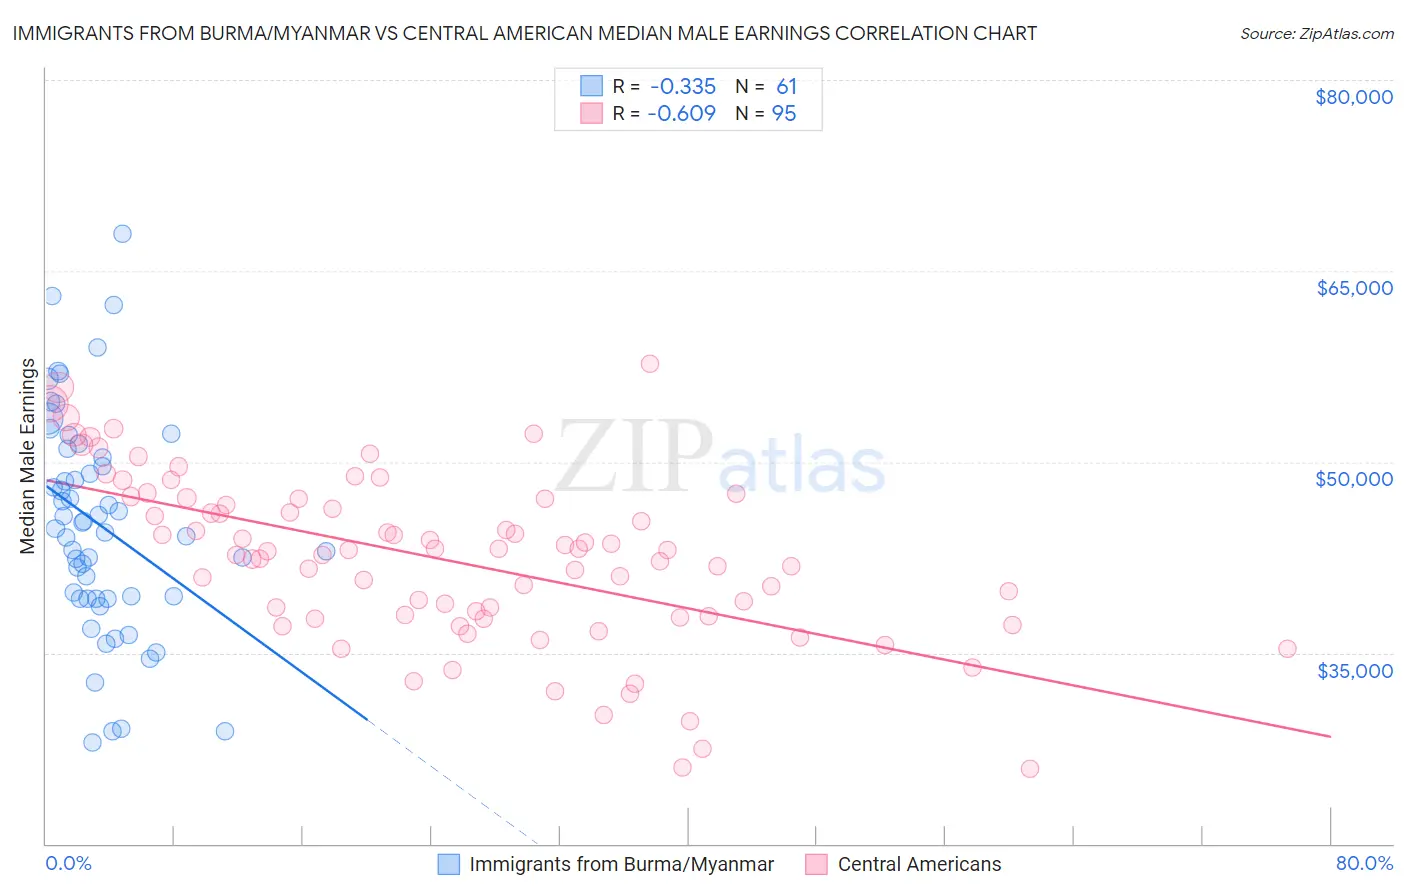
Immigrants from Burma/Myanmar vs Central American Median Male Earnings Correlation Chart
The statistical analysis conducted on geographies consisting of 172,350,242 people shows a mild negative correlation between the proportion of Immigrants from Burma/Myanmar and median male earnings in the United States with a correlation coefficient (R) of -0.335 and weighted average of $50,298. Similarly, the statistical analysis conducted on geographies consisting of 504,312,553 people shows a significant negative correlation between the proportion of Central Americans and median male earnings in the United States with a correlation coefficient (R) of -0.609 and weighted average of $48,093, a difference of 4.6%.
Median Male Earnings Correlation Summary
| Measurement | Immigrants from Burma/Myanmar | Central American |
| Minimum | $27,990 | $25,893 |
| Maximum | $67,960 | $57,715 |
| Range | $39,970 | $31,822 |
| Mean | $45,043 | $42,312 |
| Median | $44,781 | $42,955 |
| Interquartile 25% (IQ1) | $39,264 | $37,781 |
| Interquartile 75% (IQ3) | $50,701 | $47,084 |
| Interquartile Range (IQR) | $11,437 | $9,303 |
| Standard Deviation (Sample) | $8,603 | $6,615 |
| Standard Deviation (Population) | $8,532 | $6,580 |
Similar Demographics by Median Male Earnings
Demographics Similar to Immigrants from Burma/Myanmar by Median Male Earnings
In terms of median male earnings, the demographic groups most similar to Immigrants from Burma/Myanmar are Osage ($50,292, a difference of 0.010%), Immigrants from Grenada ($50,279, a difference of 0.040%), Immigrants from Guyana ($50,321, a difference of 0.050%), Subsaharan African ($50,408, a difference of 0.22%), and Immigrants from Ecuador ($50,474, a difference of 0.35%).
| Demographics | Rating | Rank | Median Male Earnings |
| Guyanese | 2.2 /100 | #242 | Tragic $50,613 |
| French American Indians | 2.2 /100 | #243 | Tragic $50,611 |
| Houma | 2.0 /100 | #244 | Tragic $50,547 |
| Hawaiians | 1.9 /100 | #245 | Tragic $50,488 |
| Immigrants | Ecuador | 1.9 /100 | #246 | Tragic $50,474 |
| Sub-Saharan Africans | 1.8 /100 | #247 | Tragic $50,408 |
| Immigrants | Guyana | 1.6 /100 | #248 | Tragic $50,321 |
| Immigrants | Burma/Myanmar | 1.6 /100 | #249 | Tragic $50,298 |
| Osage | 1.6 /100 | #250 | Tragic $50,292 |
| Immigrants | Grenada | 1.6 /100 | #251 | Tragic $50,279 |
| Immigrants | Cabo Verde | 1.2 /100 | #252 | Tragic $50,009 |
| German Russians | 1.1 /100 | #253 | Tragic $49,924 |
| Senegalese | 1.0 /100 | #254 | Tragic $49,774 |
| Alaskan Athabascans | 0.9 /100 | #255 | Tragic $49,748 |
| Alaska Natives | 0.9 /100 | #256 | Tragic $49,711 |
Demographics Similar to Central Americans by Median Male Earnings
In terms of median male earnings, the demographic groups most similar to Central Americans are Marshallese ($48,137, a difference of 0.090%), Immigrants from Jamaica ($48,040, a difference of 0.11%), African ($47,994, a difference of 0.21%), Paiute ($47,991, a difference of 0.21%), and Mexican American Indian ($47,990, a difference of 0.22%).
| Demographics | Rating | Rank | Median Male Earnings |
| Immigrants | Somalia | 0.3 /100 | #275 | Tragic $48,439 |
| Blackfeet | 0.3 /100 | #276 | Tragic $48,402 |
| Belizeans | 0.2 /100 | #277 | Tragic $48,358 |
| Immigrants | Liberia | 0.2 /100 | #278 | Tragic $48,317 |
| Hmong | 0.2 /100 | #279 | Tragic $48,254 |
| Comanche | 0.2 /100 | #280 | Tragic $48,202 |
| Marshallese | 0.2 /100 | #281 | Tragic $48,137 |
| Central Americans | 0.2 /100 | #282 | Tragic $48,093 |
| Immigrants | Jamaica | 0.2 /100 | #283 | Tragic $48,040 |
| Africans | 0.2 /100 | #284 | Tragic $47,994 |
| Paiute | 0.2 /100 | #285 | Tragic $47,991 |
| Mexican American Indians | 0.2 /100 | #286 | Tragic $47,990 |
| Immigrants | El Salvador | 0.2 /100 | #287 | Tragic $47,973 |
| Shoshone | 0.2 /100 | #288 | Tragic $47,930 |
| Chickasaw | 0.1 /100 | #289 | Tragic $47,832 |